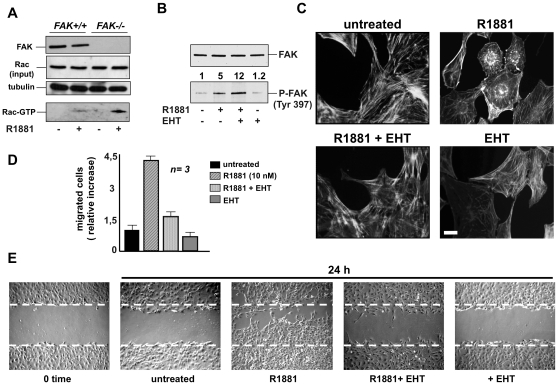
Figure 4. R1881-stimulated fibroblast migration: the role of Rac.
In A, quiescent FAK+/+ or FAK-/- fibroblasts were used. Cells were then left unstimulated or stimulated for 5 min with 10 nM R1881 and lysate proteins were analyzed by immunoblot using anti-FAK (FAK), Rac (input) or tubulin antibody. Rac activity in cell lysates was assayed in pull-down experiments (Rac-GTP). Data were analyzed using the NIH Image J program. In androgen-treated FAK-null fibroblasts, the relative increase in Rac-GTP was 3.7-fold compared to the androgen-treated FAK+/+ fibroblasts. In B, C, D and E, quiescent NIH3T3 cells were used. In B, cells were left unstimulated or stimulated for 5 min with 10 nM R1881 in the absence or presence of EHT (20 microM). Control cells were treated with EHT alone. Lysates were analyzed by immunoblot using anti-P-Tyr 397 FAK (P-Tyr-FAK) or FAK (FAK) antibodies. Data were analyzed using the NIH Image J program and expressed as relative increase. Numbers in the upper portion of corresponding blots represent the increase in P-FAK. In C, cells on coverslips were left untreated or treated for 40 min with the indicated compounds. R1881 was used at 10 nM and EHT 1864 at 20 µM. Cells were then analyzed by IF for F-actin. Images are representative of three independent experiments. Scale bar, 5 microm. In D, migration assay on collagen-coated Transwell filters was performed in the absence or presence of the indicated compounds. R1881 was used at 10 nM and EHT 1864 at 20 microM. Migrating cells were stained with Hoechst and counted with fluorescent microscope as described in Methods. Data were expressed as relative increase in number of migrated cells. Means and SEM are shown; n represents the number of experiments. The statistical significance of results was also evaluated by Student's t test. P values were <0.001 for cells stimulated with 10 nM R1881. The difference in relative migration between cells challenged with 10 nM R1881 in the absence or presence of EHT was significant (P<0.001). The difference in relative migration between unstimulated cells and cells stimulated with 10 nM R1881 in the presence of EHT or between unstimulated cells and EHT-treated cells was not significant. In E, the cells were wounded and then left unstimulated or stimulated for the indicated time with 10 nM R1881 in the absence or presence of 20 microM EHT. Control cells were treated with EHT alone (at 20 microM). Contrast-phase images are representative of three different experiments, each performed in duplicate.

