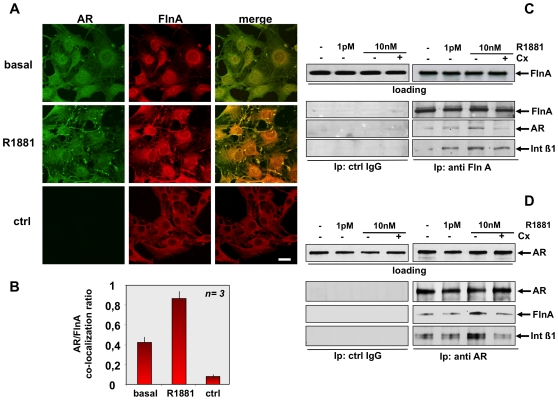
Figure 6. R1881-induced AR/FlnA/integrin beta 1 complex in fibroblasts.
Quiescent NIH3T3 cells were left untreated (basal) or treated for 5 min with 10 nM R1881 (R1881). In A, cells on coverslips were visualized by IF for AR and FlnA. Images captured by confocal microscope show the staining of AR (green) and FlnA (red). Right panels show the merged images. The lowest images are representative of a control IF staining devoid of the primary anti-AR antibody (ctrl). Left image shows FITC-secondary antibody alone, middle image shows Fln A (red). Right image shows the merge. Scale bar, 5 microM. Graph in panel B represents the quantification and statistical analysis of different experiments. AR/FlnA co-localization ratio was calculated as described in Methods. Means and SEM are shown; n represents the number of experiments. The statistical significance of results was also evaluated by Student's t test. The difference in AR/FlnA co-localization ratio between unstimulated (basal) and R1881-stimulated cells was significant (P<0.005). Also significant (P<0.005) was the difference in AR/FlnA co-localization ratio between control cells (ctrl) and either unstimulated (basal) or R1881-stimulated cells. In C and D, quiescent NIH3T3 cells were left untreated or treated for 5 min with the indicated concentrations of R1881. The anti-androgen Casodex (Cx) was used at 10 microM. Cell lysates were immunoblotted with antibody against the indicated proteins (loading). Lysate proteins containing similar amounts of FlnA (C) or AR (D) were immunoprecipitated with anti-FlnA (C) or anti-AR (D) antibody. Similar amounts of lysate proteins were also immunoprecipitated with control IgG (ctrl IgG). Proteins in immunocomplexes were analyzed using antibodies against the indicated proteins.

