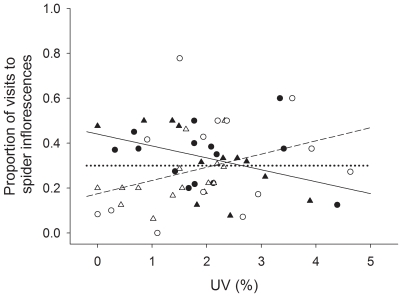
Figure 4. Effect of spider UV and spider size on honeybee behaviour (Experiment 1).
Proportion of honeybee visits to spider inflorescences vs spider UV reflectance considering only those trials that received more than four honeybee visits to the patch. Trials with less than five visits were removed because the statistical model gives relatively little weight to trials with few honeybee visits. Black symbols represent small spiders (prosoma width <3.44 mm) and white symbols represent large spiders (prosoma width >3.44 mm). The value of 3.44 mm represents the median value of spider prosoma's width for trials that received more than four honeybee visits to the patch. Triangles represent yellow spiders and circles represent white spiders. Regression lines between proportion of honeybee visits to spider inflorescences and spider UV reflectance for small (solid line) and large (dashed line) spiders are given in the figure, together with the expected proportion of visits to spider inflorescences if honeybees treated all inflorescences alike (p = 1/3; dotted line).

