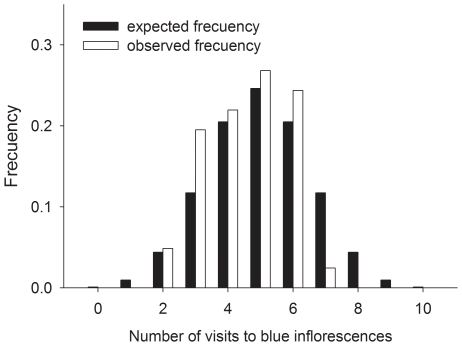
Figure 9. Effect of blue spots on honeybee behaviour (Experiment 3).
Histograms showing the expected frequency of the number of honeybee visits to blue inflorescences when honeybees are equally like to visit control and blue inflorescences (black bars) and the observed frequency for the number of honeybee visits to blue inflorescences in Experiment 3 (white bars).

