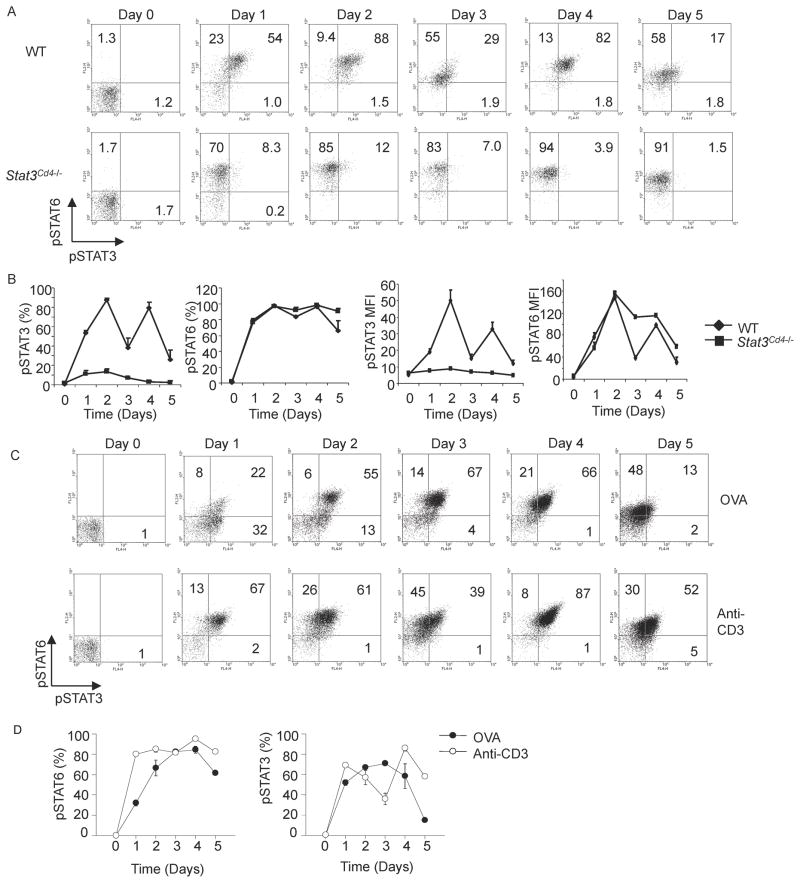
Figure 1. STAT3 is Activated During Th2 cell Differentiation.
(A) Wild type (WT) and Stat3Cd4−/ − naïve CD4+ T cells were activated with anti-CD3 and anti-CD28 and cultured in IL-4 and anti-IFN-γ (Th2 conditions). Each day during differentiation, cells were stained for intracellular phospho-STAT3 and phospho-STAT6. Numbers in flow cytometry dot plots indicate the percentages of cells in each quadrant.
(B) Graphical representation of percent phospo-STAT-positive cells and mean fluorescent intensity (mean ± s.d.). Data are an average of two mice and are representative of 2–3 experiments.
(C) Naïve DO11.10 TCR transgenic T cells were stimulated with anti-CD3 or ovalbumin (OVA) in the presence of antigen-presenting cells and cultured under Th2 conditions. Each day during differentiation, cells were stained for intracellular phospho-STAT3 and phospho-STAT6. Numbers in flow cytometry dot plots indicate the percentages of cells in each quadrant.
(D) Graphical representation of average percent phospho-STAT-positive cells for DO11.10 TCR transgenic T cells stimulated with OVA or anti-CD3 (mean ± s.d.). Data are an average of two mice and are representative of 2 experiments.

