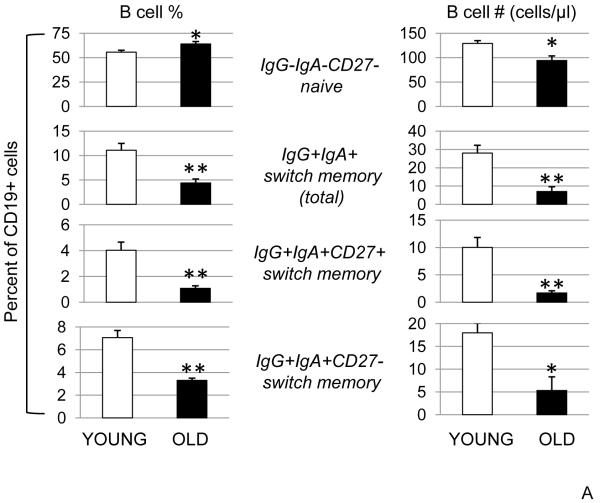
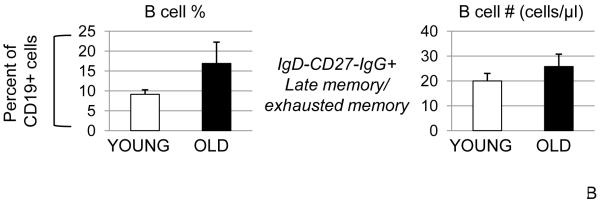
Figure 1. Age-related changes in the percentages and numbers of B cell subsets.
A. One hundred μl of blood from young (20-64 years) and elderly (≥65 years) subjects were stained to evaluate the percentages of naïve and switch memory B cells. The percentages of IgM memory (IgG−IgA−CD27+, not shown) were unchanged in young and old and together with naïve and total switch memory add up to 100%. Sixty-six young and forty-six elderly subjects were evaluated. The differences between young and elderly subjects were evaluated by the Wilcoxon test (two-tailed). p<0.05 (*), p<0.01 (**). B. Fifty young and twenty-five elderly subjects were evaluated.


