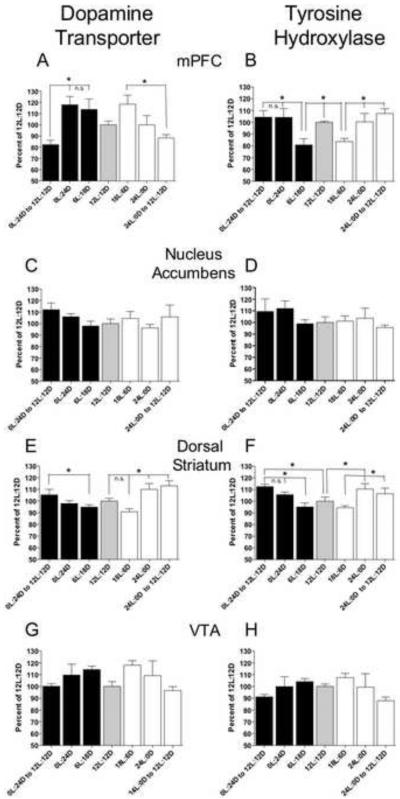
Figure 5.
Protein levels of DAT and TH are altered in the mPFC and the dorsal striatum by photoperiod shifts in drug-naïve rats. Data are mean (± SEM) of DAT and TH protein levels expressed as a percent of 12L:12D levels in the mPFC (A, B) the nucleus accumbens, (C, D) the dorsal striatum, (E, F) and the VTA (G, H). Differences were found in the mPFC and dorsal striatum for both DAT and TH, while no changes were found in the nucleus accumbens or the VTA. Significant differences between groups are indicated by an asterisk. N = 6/group.

