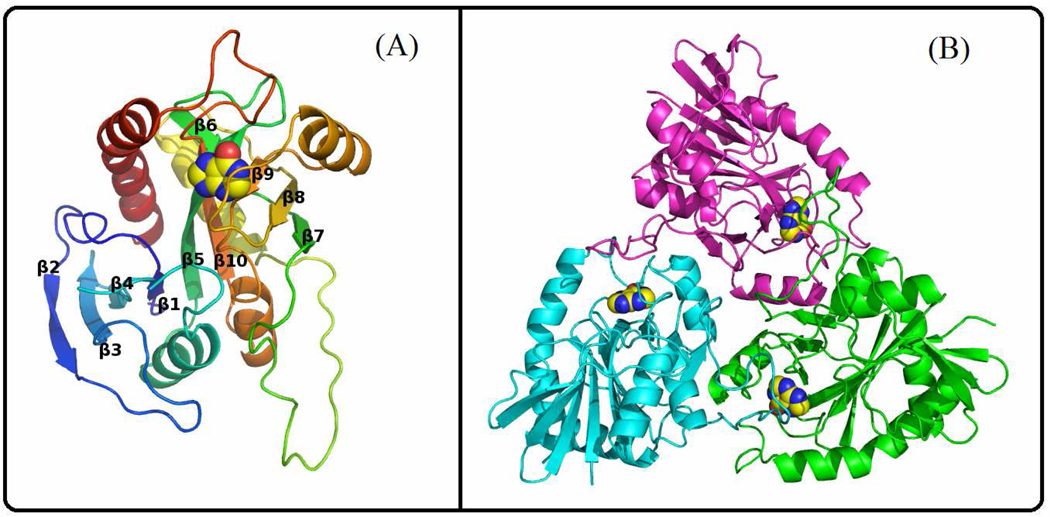
Figure 3.
Crystal structure of PaMTIP. (A) A view of the PaMTIP monomer looking toward the catalytic site. The structure is colored from blue (N-terminus) to red (C-terminus). Hypoxanthine is included as a space-filling model to show the position of active site. (B) The monomers of trimeric PaMTIP are shown in blue, green and magenta. Hypoxanthine is included as space-filling models.

