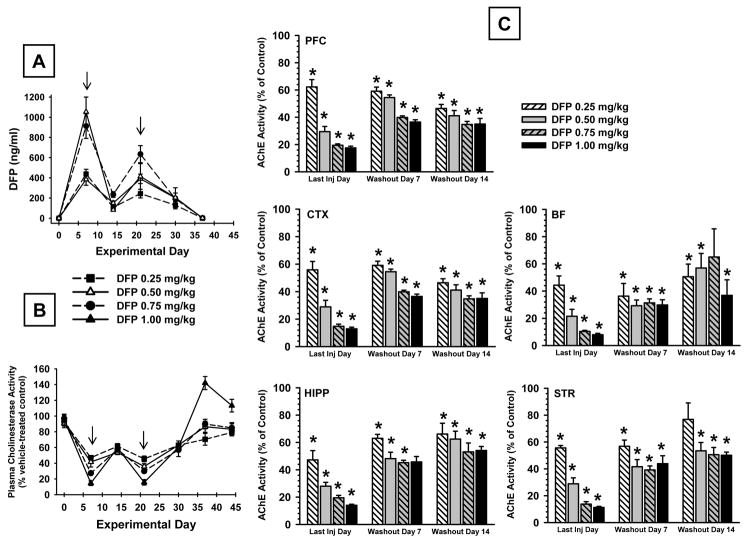
Fig 7.
(A) Plasma concentrations of DFP during a treatment regimen in which DFP was administered s.c. on alternate days over a 30 day period followed by a 14 day wash-out period. The arrows indicate days during which DFP was administered prior to removing the blood sample for analysis. Each value represents the mean ± S.E.M. derived from 6 rats. (B). Plasma cholinesterase activity as a percent of control during a treatment regimen in which DFP was administered s.c. on alternate days over a 30 day period followed by a 14 day wash-out period. The arrows indicate days during which DFP was administered prior to removing the blood sample for analysis. Each value represents the mean ± S.E.M. derived from 5-6 rats. (C) Brain acetylcholinesterase activity as a percent of control measured in 5 brain regions on the last day of a 30-day alternate injection regimen as well as in separate groups of animals at 7 and 14 days after the last DFP administration. Each value represents the mean ± S.E.M. derived from 5-6 rats. *p<0.05 with respect to vehicle control mean.

