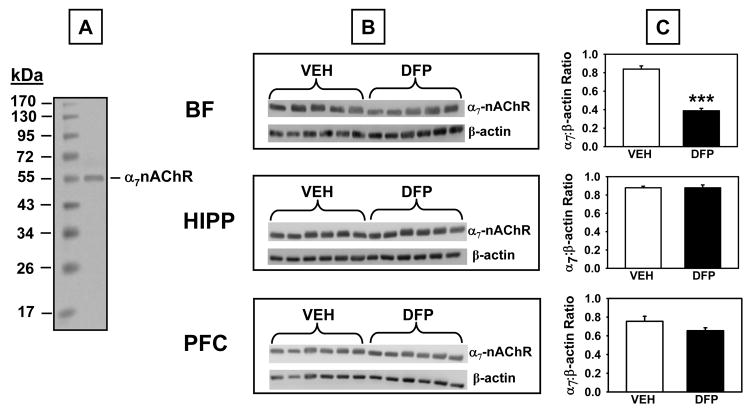
Fig 8.
α7 nicotinic acetylcholine receptor (α7 nAChR) levels measured by Western Blot in brain lysates derived from rats that had completed the 1.00 mg/kg alternate day regimen of DFP plus the two-week washout period. A. Representative blot illustrating a molecular weight marker and α7 nAChR protein (~56 kDa). B. Blots illustrating α7 nAChR protein and β-actin (~38-40 kDa) in the same samples from basal forebrain (BF), hippocampus (HIPP), and prefrontal cortex (PFC). C. Data presented in the bar graphs were obtained from densitometry measurements of the bands for α7 nAChR and β-actin and the represent the mean ± SEM for the ratio. *** indicates significant difference compared to vehicle-treated control rats, p<0.001, two-tailed Student’s t-tests. N = 5-6.

