
Fig. 2.
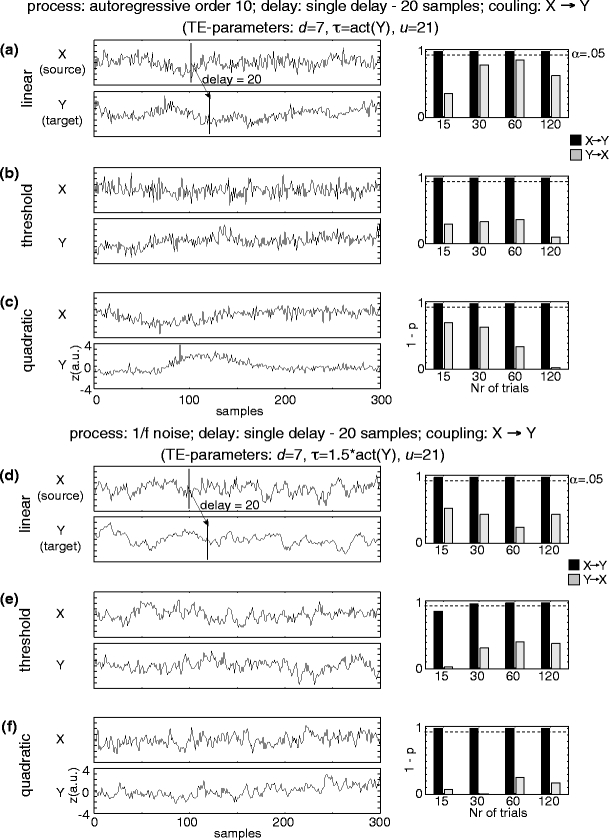
Detection of effective connectivity by TE for two unidirectionally coupled signals (X →Y). (a–c) Signals generated from an autoregressive order ten process and coupled via (a) linear, (b) threshold, and (c) quadratic coupling. (d–f) Signals generated with dynamics of a 1/f noise process and coupled via (d) linear, (e) threshold, and (f) quadratic coupling. A single interaction delay of 20 samples was used. Time courses of source (X) and target (Y) signals on the left and results of permutation testing for a varying number of trials (15, 30, 60, 120) on the right. Black bars indicate (1-p) values for coupling X →Y (true coupling direction), gray bars indicate values of (1-p) for coupling Y →X. The dashed line corresponds to significant effective connectivity (p < 0.05)