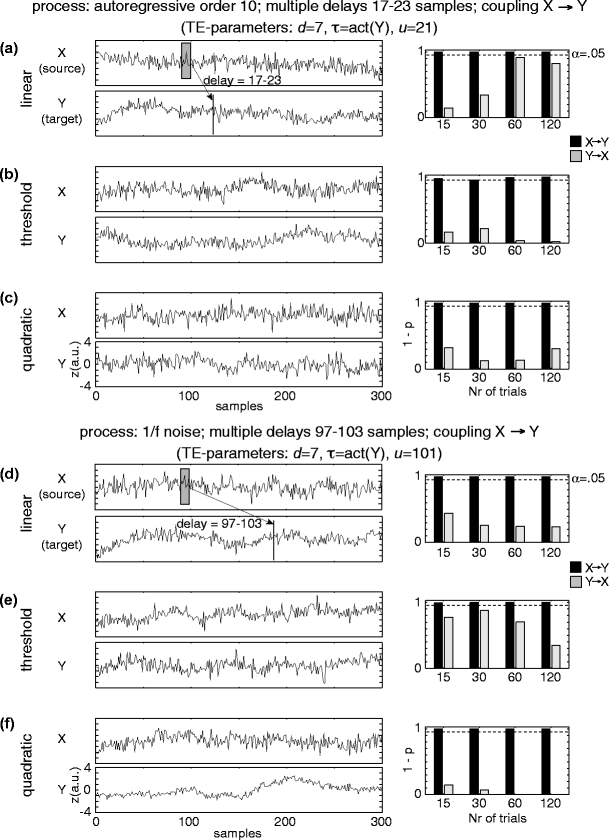
Fig. 3.

Detection of effective connectivity by TE for two unidirectionally coupled time series (X →Y) with a range of coupling delays as indicated by the shaded boxes in (a) and (d). (a–c) autoregressive order ten processes; interaction delays 17–23 samples. (a) Linear interaction, (b) threshold coupling, and (c) quadratic coupling. (d–f) 1/f processes; interaction delays 97–103 samples. (d) Linear interaction, (e) threshold coupling, and (f) quadratic coupling. Time series are plotted on the left, results of permutation testing for different numbers of simulated trials (15, 30, 60, 120) on the right. Black bars indicate values of (1-p) for coupling X →Y (true coupling direction), gray bars indicate values of (1-p) for coupling Y →X. The dashed line corresponds to significant effective connectivity (p < 0.05)
