
Fig. 5.
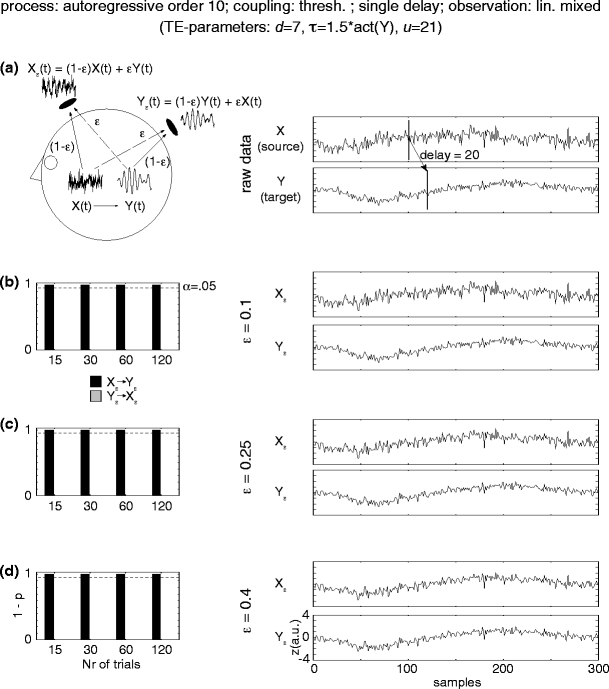
Simulation results for linearly mixed measurements (X ε, Y ε ) of two unidirectionally coupled underlying source signals (X →Y) coupled via a threshold function. (a) Mixing model and original autoregressive source time courses X, Y. (b–d) Effective connectivity between sensor-level signals X ε, Y ε. Left statistics of permutation tests of TE values for the original sensor level data against trial-shuffled surrogate data after application of the additional time-shift test. Black bars indicate values for the effective connectivity from the sensor dominated by the driving source signal (X ε) to the sensor dominated by the receiving source signal (Y ε). Light grey bars indicate the reverse direction of effective connectivity. The dashed line corresponds to siginificant effective connectivity (p < 0.05). Right time-courses of signals X ε and Y ε for a single trial