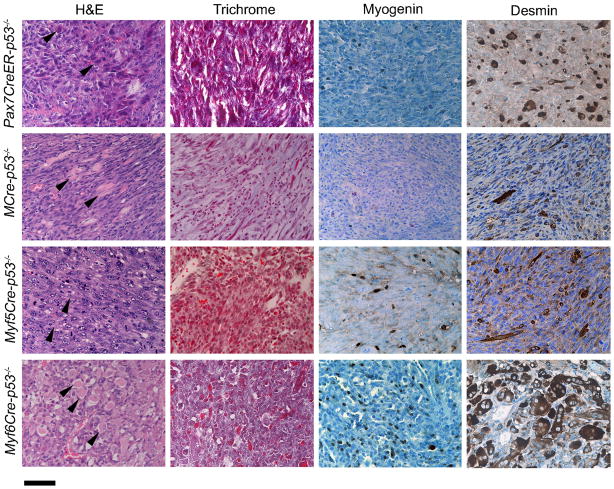
Figure 3. Histological analysis of p53−/− eRMS in each Cre line.
Representative cases with eRMS are presented. H&E staining, Masson s trichrome, and immunohistochemical staining of Myogenin and Desmin were performed for diagnosis of all tumors. Eosinophilic rhabdomyoblasts are highlighted by arrows. Scale bar, 40 μm.

