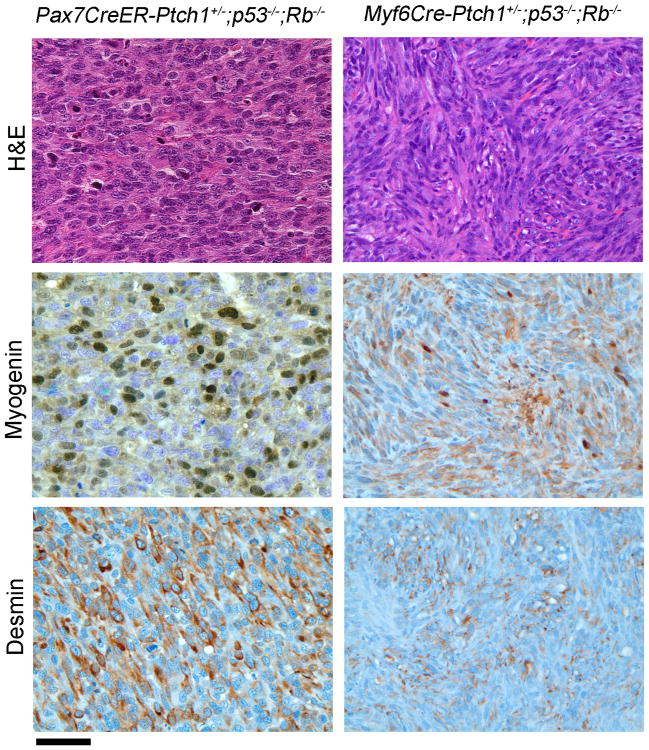
Figure 4. Histology of Ptch1+/−;p53−/−;Rb1−/− eRMS from Pax7CreER and Myf6Cre lines.
Shown are the areas with the most immunoreactivity. The majority of the tumors did not exhibit immunopositivity. Histologically, tumors appeared as either poorly differentiated epithelioid cell (left) or spindle cell (right) neoplasms and only showed rhabdomyoblastic differentiation by immunohistochemistry. Scale bar, 40 μm. See also Figure S2.

