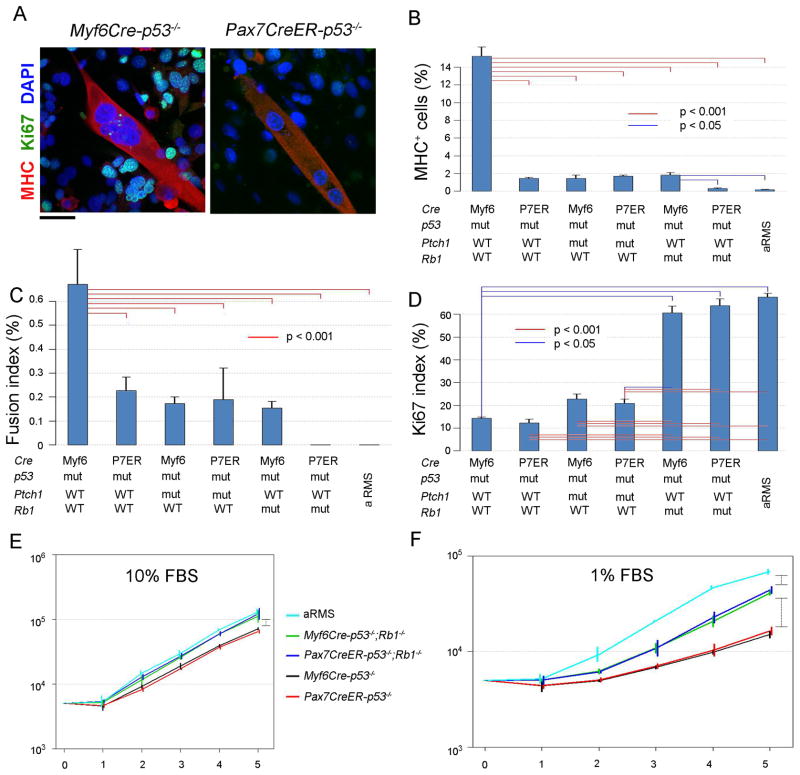
Figure 5. Cellular phenotypes of primary tumor cell cultures vary by cell of origin and mutation profile.
(A) Cell lines from both Myf6Cre-p53 and Pax7CreER-p53 tumors formed multinuclear myotubes, which were positive for myosin heavy chain (MHC). scale bar, 40 μm.
(B) Percentage of MHC-positive cells was calculated in each cell line. Total cells in 5 views of 100x fields were counted in each cell line. WT, wild type. mut, mutant. aRMS, alveolar rhabdomyosarcoma tumors from Myf6Cre-Pax3P3F/P3F;p53−/− mice.
(C) Fusion index (percentage of cells with MHC-positive (MHC+) multi-nuclear myotubes /total cells) was calculated.
(D) Ki67 index (percentage of Ki67-positive cells /total cells) was calculated.
(E–F) In vitro growth properties of each cell line under normal (10% fetal bovine serum (FBS), E) and low (1% FBS, F) serum conditions. Vertically oriented brackets represent comparisons for which p values are < 0.001.
For all panels in this figure, p values represents ANOVA with Tukey's multiple testing correction. For Figure 5B–C, values were log transformed. Rank order was used for Figure 5D. Error bars represent SEM.

