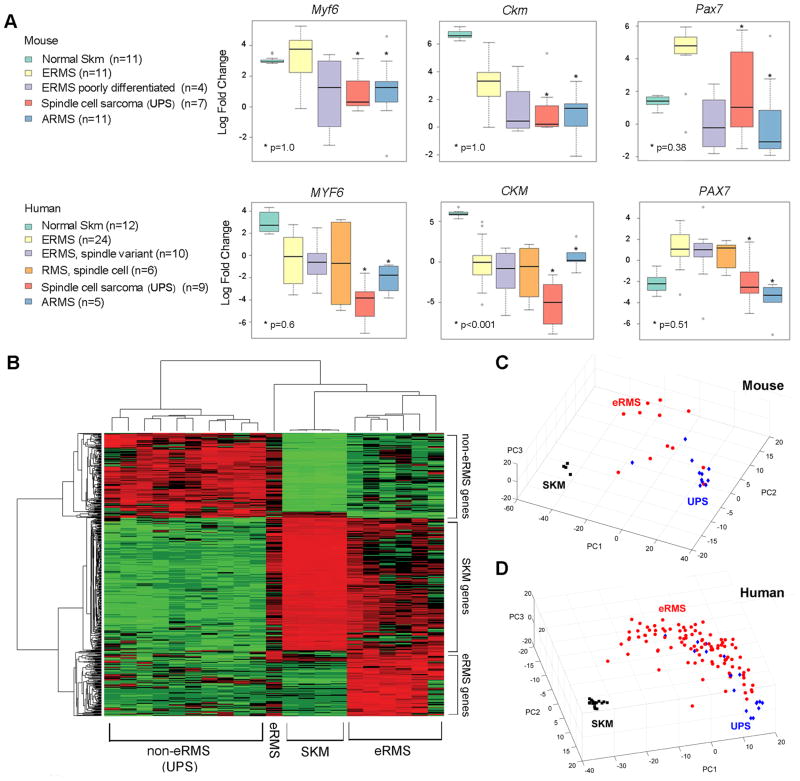
Figure 6. Continuum of Gene Expression Features in Mouse and Human Sarcomas.
(A) Expression of myogenic markers in mouse and human SKM, eRMS, UPS and intermediate diagnoses. aRMS is shown in comparison. Mouse genes have the first letter capitalized, whereas human genes have all letters capitalized. Error bars represent SEM.
(B) Supervised clustering identified the genes specifically up-regulated in each group, eRMS, non--eRMS (UPS), and skeletal muscles (SKM) (raw p-value <0.05 & fold change>2). A gene list of eRMS specific genes is shown as Table S2. Tumors analyzed are Ptch1,p53 tumors without Rb1 deletions from Pax7CreER, MCre, Myf5Cre, and Myf6Cre lineages.
(C) Principal component analysis for mouse tumors using the 345 signature genes that differentiated ERMS (red) and UPS (blue) mouse tumors from normal skeletal muscle (black).
(D) Principal component analysis for human RMS, UPS and normal skeletal muscle samples using 283 significant probes that reached significance (p-value < 0.05 & fold change > 1.5).

