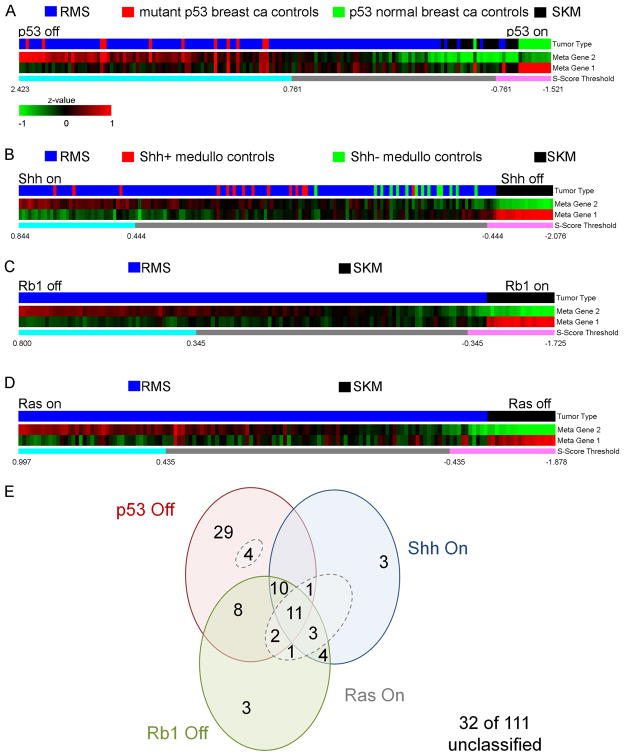
Figure 8. Heatmaps of human fusion-negative rhabdomyosarcomas for gene signatures representing the p53, Shh and Rb1 pathways.
(A) The p53 pathway heatmap represented as two metagenes was generated based on 320 significant genes (Benjamini and Hochberg adjusted p-value <0.05 & fold change > 2) with 183 genes were in metagene 1, whereas the other 136 genes were in metagene 2. In total, 65 of 111 fusion-negative RMS primary tumor samples (59%) exhibited a gene expression signature consistent with the p53 off state for which the S-score was greater than 0.761 (see Supplemental Experimental Procedures). All human breast cancer control samples with known p53 mutations also exhibited S-scores greater than 0.761.
(B) For the Shh signaling pathway heatmap, 111 genes were employed, 56 of which were in metagene 1, the other 55 genes were in metagene 2. Overall, 32 of 111 (29%) of tumors exhibited a gene expression signature consistent with a Shh on overdrive state for which S-score was greater than 0.444. The p-value for comparison of the S-score for Shh+ medulloblastoma controls and for Shh- medulloblastoma controls was 2.62x10⁻⁵ as calculated by the Wilcoxon rank sum test.
(C) For the Rb1 pathway, 381 genes were used to construct the heatmap, with 157 in metagene 1, and 224 genes in metagene 2. For the Rb1 pathway, 42 of 111 (38%) of samples demonstrated an Rb1 off state with an S-score greater than 0.345.
(D) To evaluate the Ras pathway, 87 genes common to zebrafish eRMS and human Ras-driven pancreatic cancer were used to construct the heatmap, with 24 genes in metagene 1, and 63 genes in metagene 2. For the Ras pathway, 25 of 111 of samples demonstrated a Ras on state with an S-score greater than 0.477, but after exclusion of 2 samples that did not also contain a Ras signature common to Ras-activated mammary epithelial cells, only 23 of 111 samples (21%) were felt to have a strict Ras signature. None of the Ras signature samples (breast similar or pancreatic similar) had a Ras activation signature in the absence of mutant p53, Shh or Rb1 signatures.
(E) Venn diagram showing the intersection of signatures amongst human fusion-negative soft tissue sarcomas. ca, cancer. Ras On samples are encircled with dotted lines.
See also Figure S3 and Tables S6–S10.

