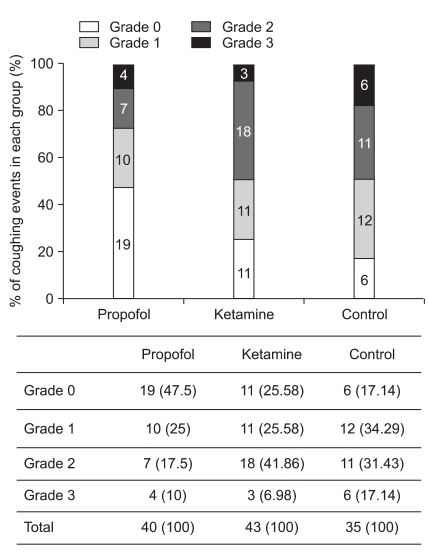
Fig. 1.
Occurrence of cough (Grades 0-3) and the percentage of coughing events recorded in each group (propofol, ketamine, control). The table provides the absolute recorded numbers and proportions [n=number of Grades 0, 1, 2, or 3 coughing events recorded, irrespective of the time point of interest (%, proportion of the total number of coughing events in the group)]. Grade 0, no cough; Grade 1, mild cough; Grade 2, moderate cough; Grade 3, severe cough. Propofol vs control (P = 0.047). Ketamine vs control (P > 0.05) by Pearson χ2 tests.

