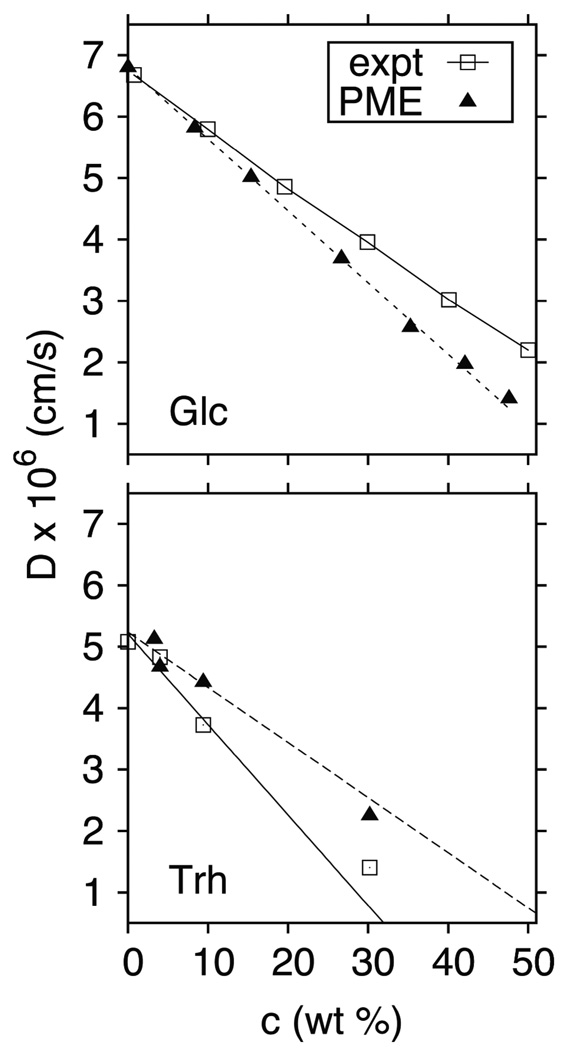
Figure 4.
Experimental8,21 and scaled simulated translational diffusion constants for glucose (top) and trehalose (bottom) at 25° C. The solid (experiment) and dashed (simulation) lines are linear fits to the lowest three concentrations for each case. Glucose simulation standard errors are less than 0.1×10⁻⁶ cm/s for all but the 1 M (~15 wt%) concentration, which is 0.16×10⁻⁶ cm/s; for trehalose, the simulation standard errors are 0.01×10⁻⁶ cm/s or less.

