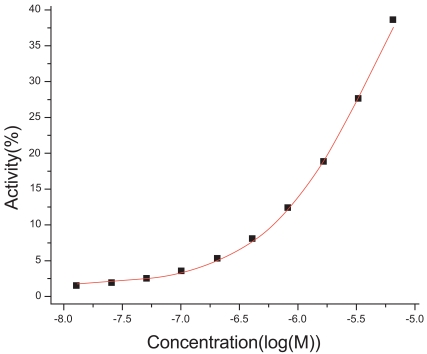
Fig. (2).
Simulated 10 data points dose-response curve with actual ymax of 90.74%. ymax from Grid program is 64.00%. The difficulty in reproducing the actual ymax by the Grid program is due to the default constraint that the boundaries for ymax is between 0.0 and 1.2*maxY. In this special case, if we remove the constraint, the solution can be much closer to the actual values. For experimental data, however, this default constraint produces more reasonable solutions.

