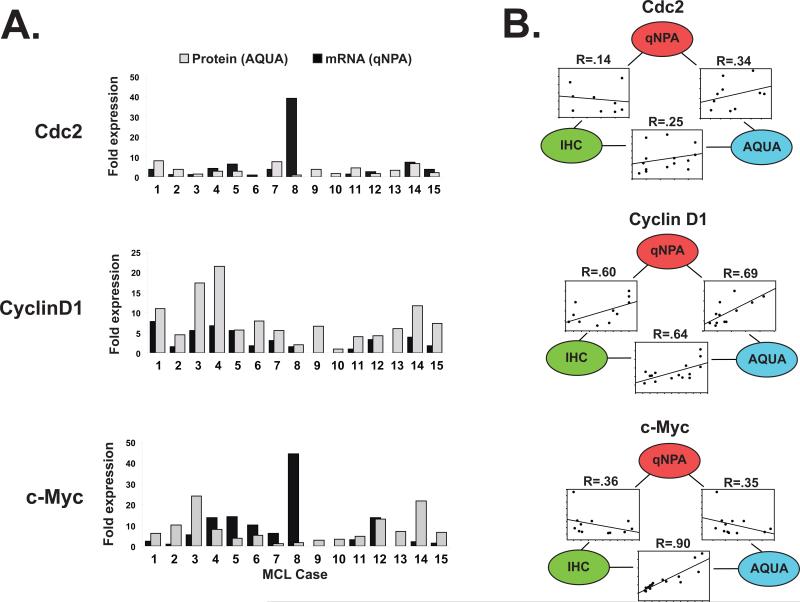
Figure 5. Correlation of target protein expression with gene expression.
(A) Target protein expression determined by AQUA and represented as fold expression levels (grey bars) are paired with mRNA levels determined by quantitative nuclease protection assay (qNPA) performed on 5μm sections of the corresponding tissue formalin-fixed paraffin-embedded tissue, normalized to two housekeeping genes and represented as fold expression levels (black bars) for 15 cases of MCL. (B) Correlation between gene expression (qNPA) and corresponding protein expression determined by AQUA or visual evaluation of DAB staining (IHC) assessed by regression analysis.

