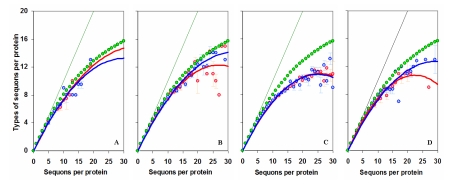
Figure 1.
Sequon types in Proteins. The mean number of sequon types versus the number of sequons per protein is shown for viral (A), archaeal (B) and eukaryotic (C) proteins, and experimentally confirmed eukaryotic N-glycoproteins (D). The NXS sequons are shown in red and NXT in blue. Inclined lines indicate the maximum number of sequon types and green dots show the mean number of sequon types per given number of sequons based on probability sampling

