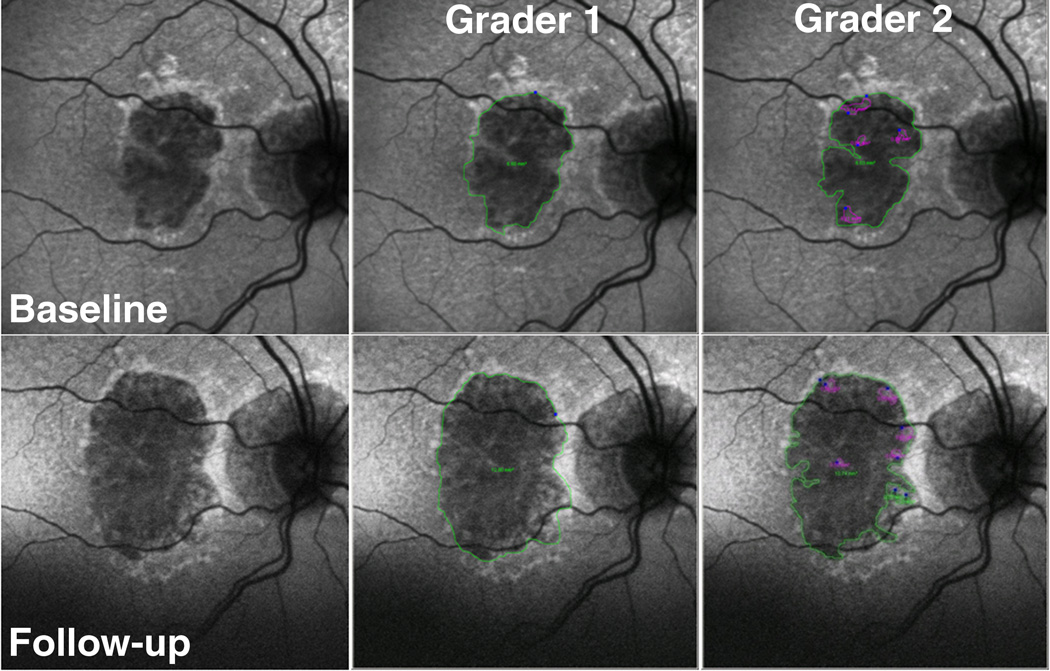
Figure 3.
Example of using fundus autofluorescence (FAF) imaging in eye with geographic atrophy (GA) in a category 3 eye followed for 21 months. The top row has baseline images, and the bottom row has follow-up images. The left column contains non-graded images, the middle column is grader 1, and the right column is grader 2. The area of GA is outlined in green, and spared areas within GA are outlined in magenta. The calculated growth of GA area was large: 6.2 mm2, and 4.79 mm2, for graders 1 and 2 respectively.

