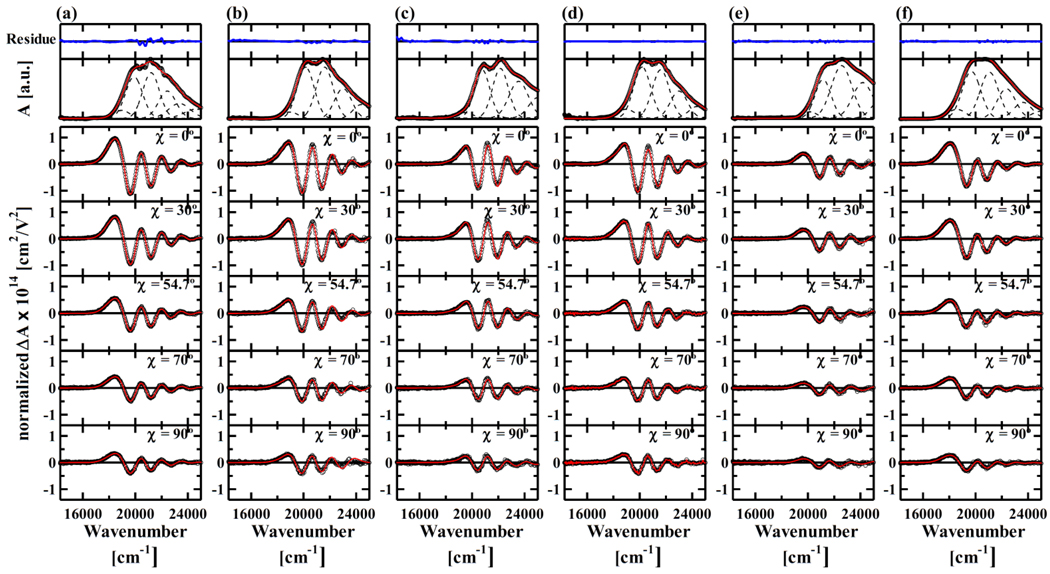
Fig. 2.
Absorption spectra (top) and the χ-dependence of Stark absorption spectra (bottom) of (a) Per, (b) B-1, (c) 9Z-B-1, (d) C-1, (e) C-1-R and (f) D-1 in PMMA at 77K. Open circles show the results of experimental observation. The Stark absorption spectra were normalized against the concentration of the samples in a PMMA film as well as the intensity of applied electric field. Red solid lines show the results of spectral fitting. The absorption spectra of Per and analogues were successfully reproduced with 6 components with Gaussian profile (broken lines in the top panel). Residuals (blue solid lines) after spectral fitting of absorption spectra were also shown in the top panel. The ordinate scale of the residuals is the same with that of absorption spectra. Stark absorption spectra observed at each χ value were fitted using Eq. (1). In order to achieve the best fit it was assumed that each Gaussian component in the corresponding absorption spectrum of the analogues has different Aχ, Bχ, and Cχ values.

