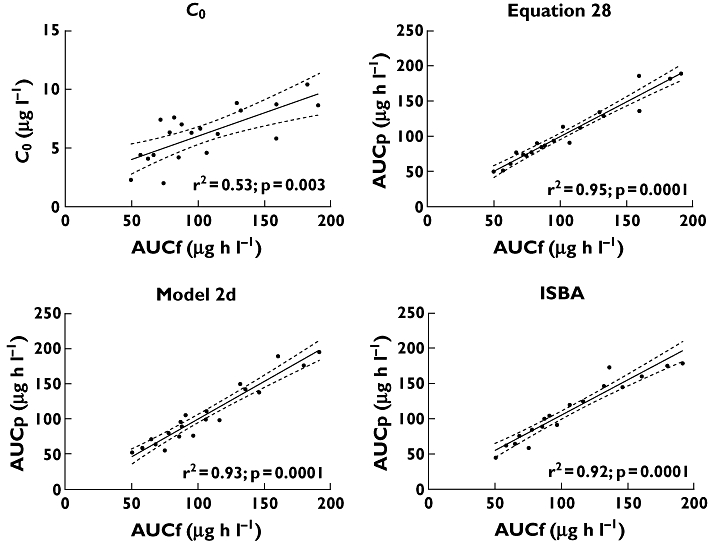
Figure 2.

Correlation between AUCf and C0, equation 28, model 2d and ISBA estimates. Continuous lines represent the linear regression lines. Dotted lines represent the 95% confidence intervals for each linear regression line

Correlation between AUCf and C0, equation 28, model 2d and ISBA estimates. Continuous lines represent the linear regression lines. Dotted lines represent the 95% confidence intervals for each linear regression line