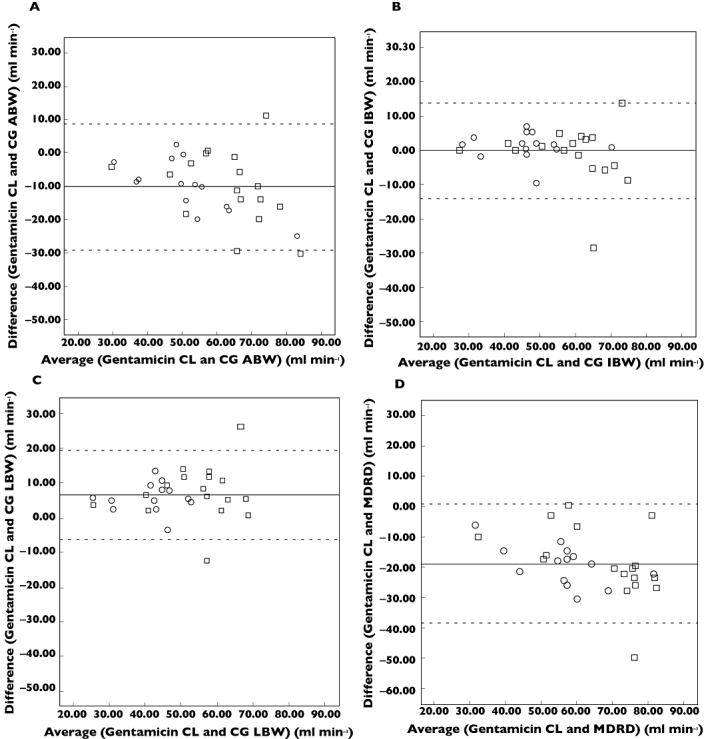
Figure 1.

Bland–Altman plots with the mean difference (solid line) and limits of agreement (dashed line) comparing different estimates of renal function with optimized gentamicin clearance. Creatinine clearance determined by the Cockcroft Gault equation using actual bodyweight (1A), ideal bodyweight (1B), lean bodyweight (1C) and estimated glomerular filtration rate determined by the Modified Diet in Renal Disease equation (1D) are plotted against gentamicin clearance. Participants were stratified by frailty, ○ frail, □ non frail. CG ABW, Cockcroft Gault estimate of creatinine clearance calculated using actual bodyweight (ml min−1); CG IBW, Cockcroft Gault estimate of creatinine clearance calculated using ideal bodyweight (ml min−1); CG LBW, Cockcroft Gault estimate of creatinine Clearance calculated using lean bodyweight (ml min−1); Gentamicin CL, Gentamicin clearance (ml min−1); MDRD, Modified Diet in Renal Disease equation estimate of glomerular filtration rate normalized for body surface area (ml min−1)
