
Figure 2.
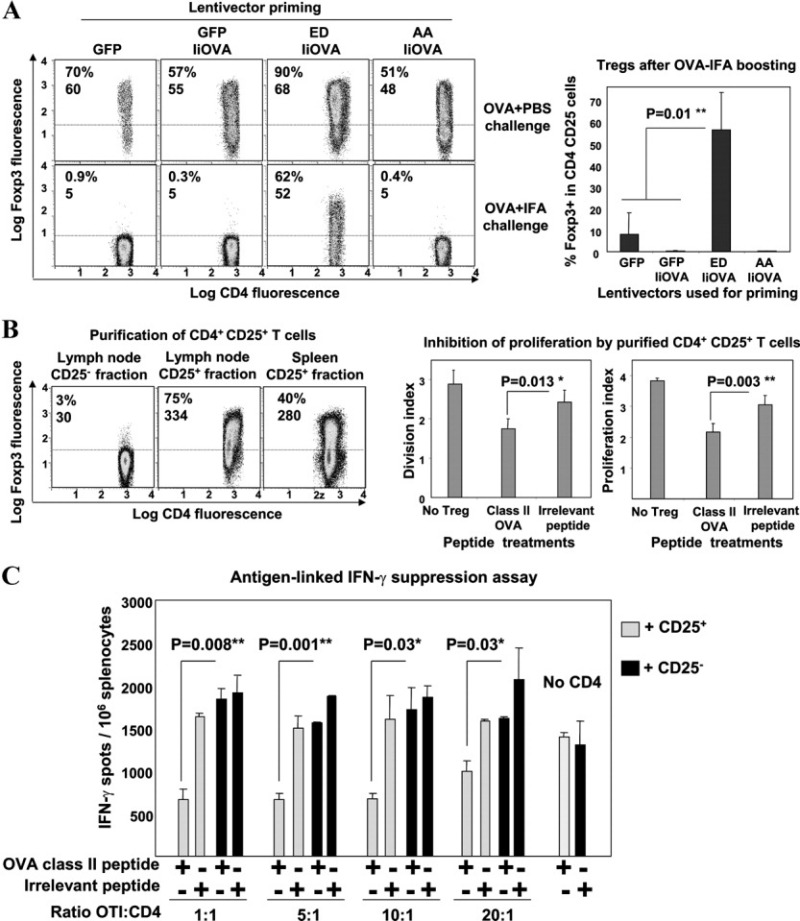
Antigen-specific FoxP3+ Treg cells undergo expansion after antigen reencounter. A, Left, FoxP3 expression in lymph node CD4+CD25+ T cells following lentivector vaccination (control constructs expressing GFP or GFP plus IiOVA, and constructs with active MEK-1 [ED] or inactive MEK-1 [AA] plus IiOVA) and rechallenge with OVA plus phosphate buffered saline (PBS) or Freund's incomplete adjuvant (IFA). Values are the percentage and mean fluorescence intensity (MFI) of FoxP3 expression. Right, Expression of FoxP3+ cells in lymph node Treg cells after lentivector priming and OVA plus IFA boosting. B, Left, FoxP3 expression in purified lymph node CD4+CD25+ T cells or spleen CD4+CD25+ T cells after active MEK-1–IiOVA priming and OVA plus IFA boosting. Values are the percentage and MFI of FoxP3 expression. Right, Inhibition of T cell proliferation according to treatment group (no Treg cells, class II OVA peptide, or irrelevant peptide), as measured by the division index and proliferation index. In A and B, the horizontal broken line indicates the cutoff for positivity. C, CD8+ IFNγ responses in peptide-pulsed OT-I mouse splenocytes incubated with purified Treg cells at the indicated ratios. A class II OVA peptide or an irrelevant peptide was present (+) or absent (−) in the assays with CD25+ or CD25− cells. Bars in A–C show the mean ± SEM results in 5 mice per group. ∗ = very significant difference (P < 0.01); ∗∗ = highly significant difference (P < 0.001). See Figure 1 for other definitions.