
Figure 3.
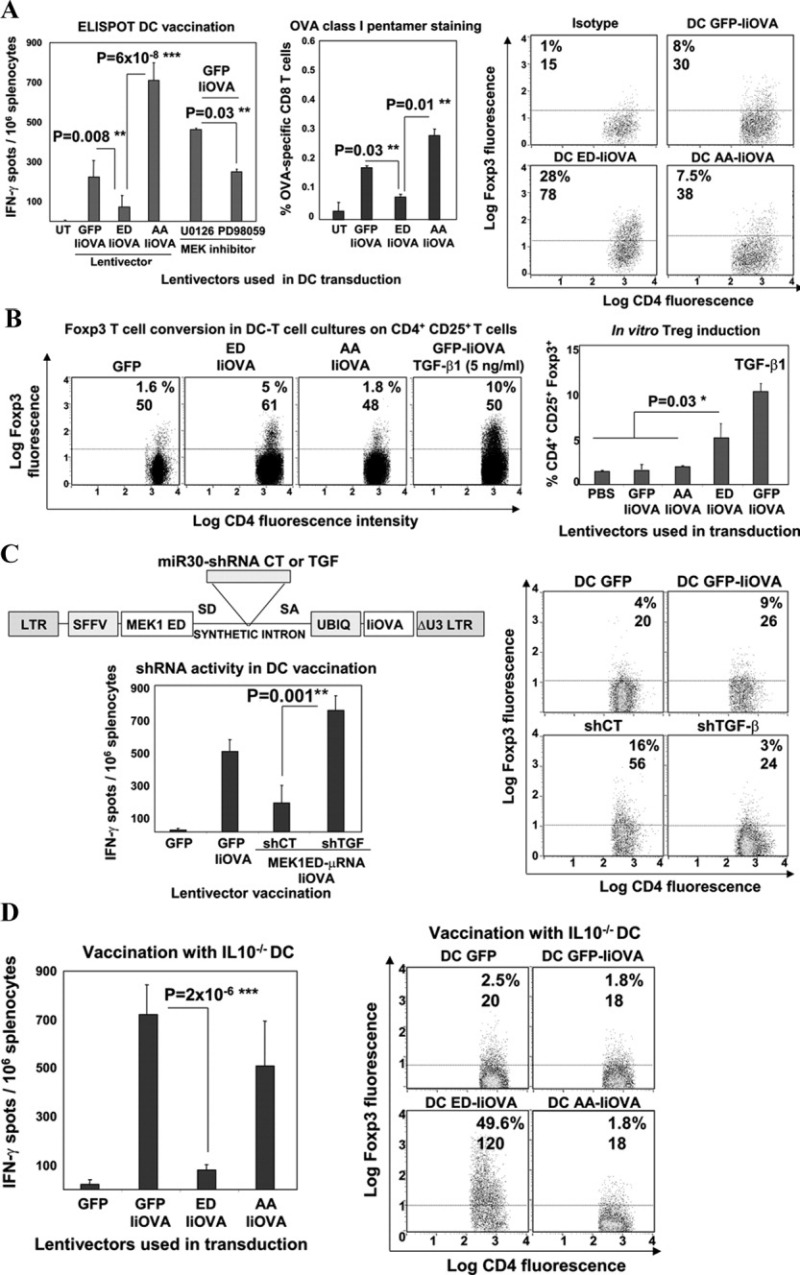
ERK-dependent immunosuppression is dependent on dendritic cell (DC)–derived transforming growth factor β (TGFβ). A, Left, CD8 T cell responses, as determined by IFNγ enzyme-linked immunospot (ELISpot) assay or OVA class I pentamer staining, after vaccination with lentivector-modified DCs (or untransduced [UT] DCs as control) or after MEK inhibitor treatments. Right, FoxP3 expression in splenocyte CD4+CD25+ T cells after lentivector vaccination. Values are the percentage and mean fluorescence intensity (MFI) of FoxP3+ expression. B, Left, FoxP3 expression in CD4+CD25+ OT-II cells cultured with transduced DCs. Values are the percentage and MFI of FoxP3 expression. Right, In vitro Treg cell induction of FoxP3 expression in the DC–T cell cocultures, without or with TGFβ1 treatment at 5 ng/ml. C, Left (top), Scheme of the lentivector short hairpin RNA (shRNA) delivery platform, highlighting the intron with microRNA miR-30 shRNA. Left (bottom), CD8+ T cell responses, as determined by IFNγ ELISpot assay, after vaccination with ex vivo lentivector-modified DCs and codelivery with TGFβ-targeted shRNA (shTGF) or control shRNA (shCT). Right, FoxP3 expression in splenocyte CD4+CD25+ T cells after vaccination with lentivector-modified DCs or shRNA, followed by OVA restimulation. Values are the percentage and MFI of FoxP3+ expression. D, Left, OVA-specific CD8 responses, as determined by IFNγ ELISpot assay, in mice vaccinated with lentivector-transduced interleukin-10–knockout (IL-10−/−) DCs. Right, FoxP3 expression in splenocyte CD4+CD25+ T cells vaccinated with transduced IL-10−/− DCs. Values are the percentage and MFI of FoxP3+ expression. Horizontal broken lines indicate the cutoff for positivity. Bars in A–D show the mean ± SEM. ∗ = significant difference (P < 0.05); ∗∗ = very significant difference (P < 0.01); ∗∗∗ = highly significant difference (P < 0.001). PBS = phosphate buffered saline; SD = splicing donor site; SA = splicing acceptor site (see Figure 1 for other definitions).