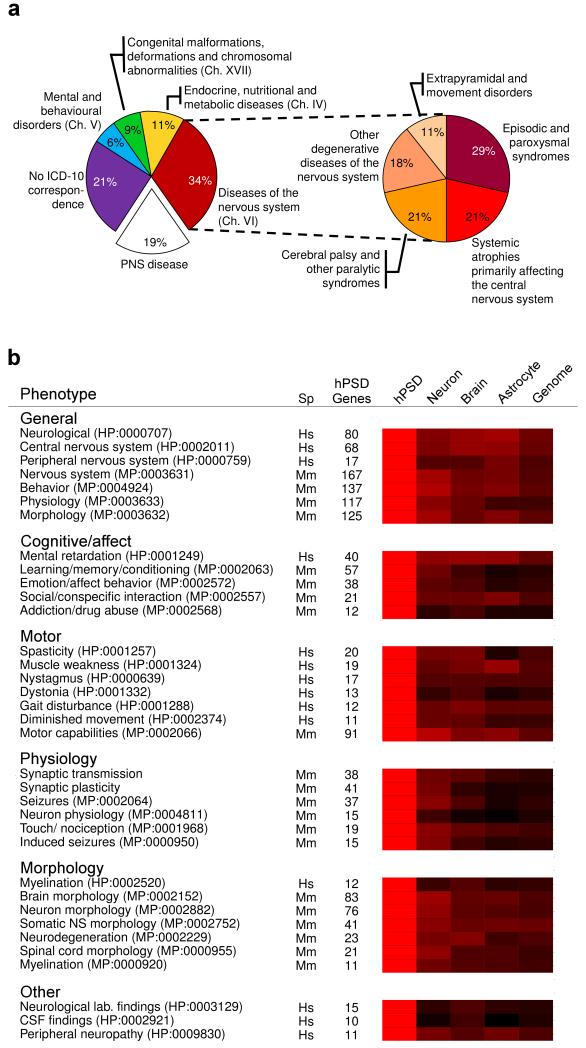
Fig. 1. hPSD Diseases and Enriched Phenotypes.
a. Distribution of hPSD nervous system diseases in 4 ICD–10 chapters (left chart) with Chapter VI expanded (right chart) to show further subclassifications.
b. Representative human and mouse phenotypes enriched in the hPSD.
Categories (bold) of human and mouse phenotypes with number of genes (hPSD genes). Heatmap compares enrichment of these phenotypes in 4 gene sets relative to the enrichment of the hPSD (shown in red). All other gene sets showed lower enrichment (darker colors with black representing no enrichment). Neuron. human cortical neuron transcriptome9; brain, whole mouse brain proteome; astrocyte, human astrocyte transcriptome10; and human genome.
Hs, human; Mm, mouse.
HPO and MPO phenotype IDs in brackets after each named phenotype.

