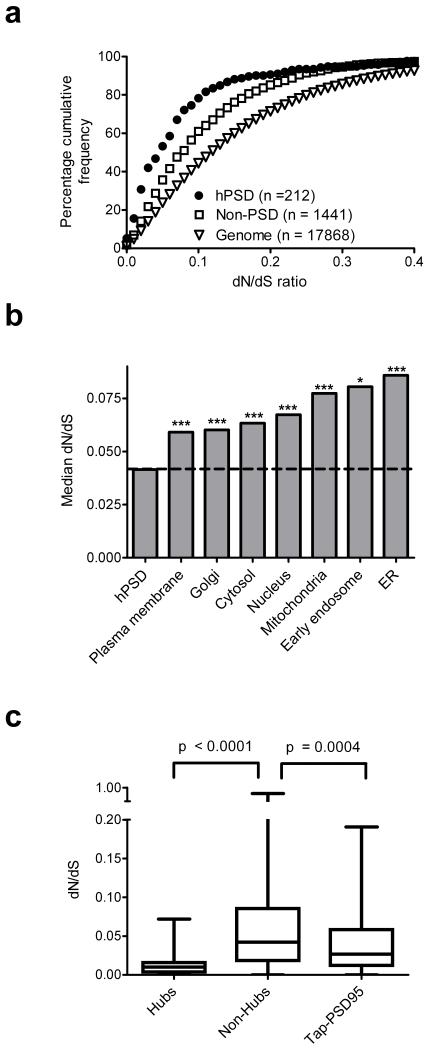
Fig. 2. hPSD sequence conservation.
a. Cumulative frequency plot of dN/dS values for hPSD and non–PSD genes expressed in cortical neurons9, and human genome. hPSD neuronal genes are more constrained than non–PSD neuronal genes (p < 10−11).
b. Median mouse–human dN/dS shown for hPSD and subcellular structures expressed in cortical neurons9. Significance: p < 0.05 (*), p< 0.001 (***).
c, Boxplots of dN/dS distribution in hPSD hub proteins (>15 interactions, n = 23), non–hubs (≤15 interactions, n = 725) and the tandem affinity purification of PSD–95 complex14.

