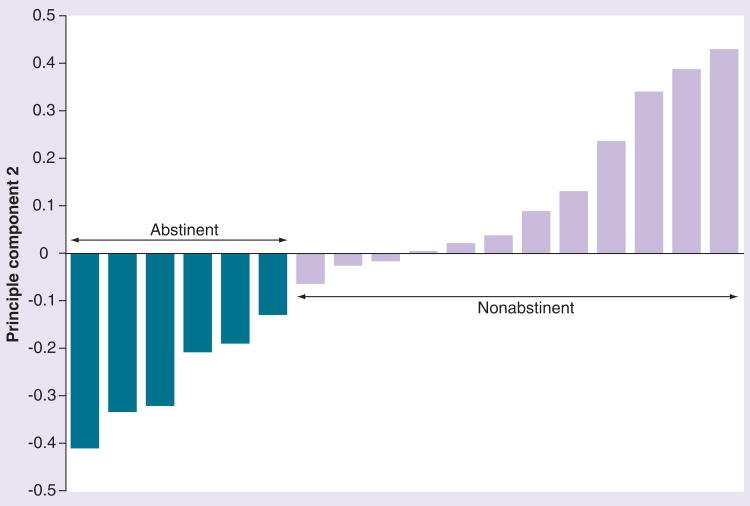
Figure 2. Values for principal component 2 from SNP data for pools of abstinent (darker bars) and nonabstinent (lighter bars) smokers.
The difference, tested by t-test and Kolmogorov–Smirnov test of component 2 coefficients between abstinent and nonabstinent pools, is statistically significant (p = 0.0001).

