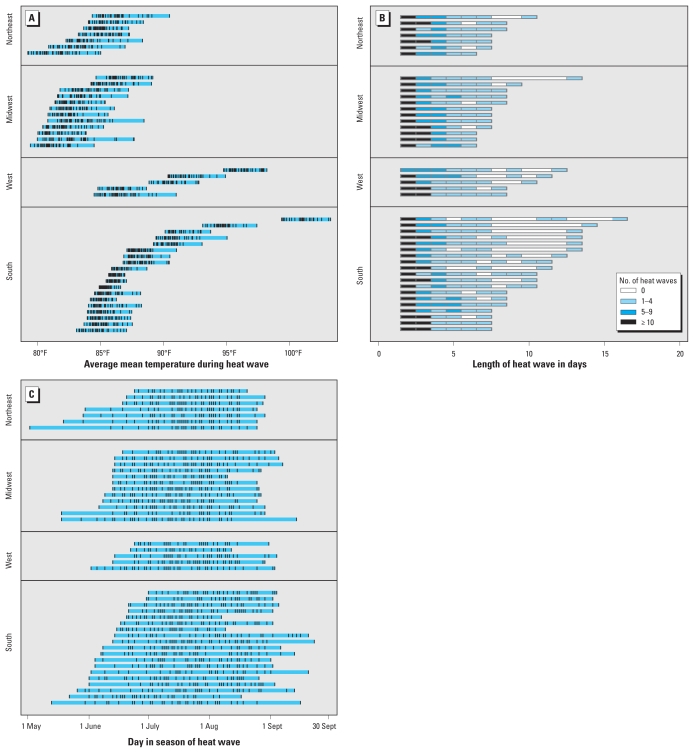
Figure 1.
Heat wave characteristics in 43 individual communities (1987–2005). Each horizontal line represents one community, and the length of each line indicates the range of each heat wave characteristic in that community. (A) Intensity of each individual heat wave within a community (tick marks within blue bars). (B) Number of heat waves according to duration (shading) by community. By definition, all heat waves lasted ≥ 2 days. (C) Heat wave timing in season by community (tick marks, individual heat waves).

