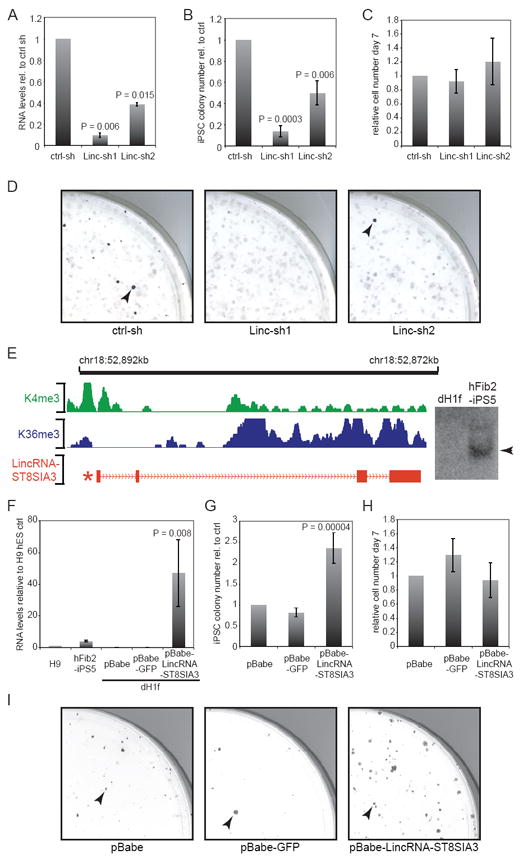
Figure 4.

LincRNA-ST8SIA3 expression modulates reprogramming. A) qRT-PCR verifies lincRNA-ST8SIA3 knock-down with Linc-sh1 and Linc-sh2 in hFib2-iPS5 cells relative to a non-targeting shRNA control (n=2, error bar: +/-s.e.m). B) Quantification of Tra-1-60+ iPSC colonies upon knock-down of lincRNA-ST8SIA3 relative to the control (day 21; n=4, error bar: +/-s.e.m). C) Quantification of cell numbers on day 6-7 of reprogramming in lincRNA-ST8SIA3 shRNA samples relative to the control (n=4, error bar: +/-s.e.m). D) Images showing quarters of Tra-1-60 stained reprogramming plates upon infection of a non-targeting control and two lincRNA-ST8SIA3 targeting shRNAs. Arrowheads mark Tra-1-60+ iPSC colonies. E) Structure of the lincRNA-ST8SIA3 locus. Green, Blue: Demarcation of the H3K4me-H3K36me domain in ESCs. Red: Structure of lincRNA-ST8SIA3 RNA; asterisk marks position of OCT4/SOX2/NANOG binding (see Figure 3A). Right: Northern hybridization of lincRNA-ST8SIA3 detects a 2.6kb transcript in hFib2-iSP5, but not dH1f (full-length blot see Supplementary Figure 12). F) qRT-PCR verifies lincRNA-ST8SIA3 overexpression from a retroviral vector (pBabe-lincRNA-ST8SIA3) compared with pBabe-puro and pBabe-puro-GFP vectors in dH1f relative to the levels in H9 ESCs and hFib2-iPS5 (n=2, error bars: +/-s.e.m). G) Quantification of Tra-1-60+ iPSC colonies upon overexpression of lincRNA-ST8SIA3 compared to pBabe and pBabe-GFP controls (n=5, error bar: +/-s.e.m.). H) Quantification of cell numbers on day 6-7 in lincRNA-ST8SIA3 overexpressing cells and controls. Cell numbers are relative to the pBabe control (day 28 +/-2; n=5, error bar: +/- s.e.m.). I) Image of quarter-plates of Tra-1-60 stained colonies (arrowheads) in pBabe, pBabe-GFP, and pBabe-lincRNA-ST8SIA3 infected samples. Statistical analysis was performed using Student’s t-test.
