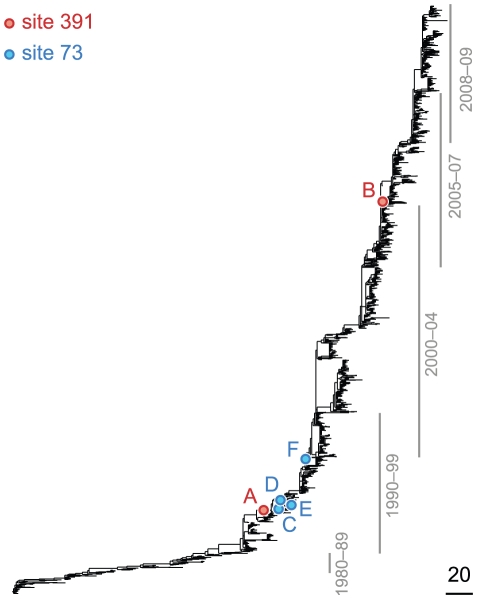
Figure 2. Phylogenetic tree of HA (subtype H3) illustrating a putatively epistatic interaction between sites 391 (red circles) and 73 (blue circles).
Site 391 is not in an epitope,  ; site 73 is epitope E,
  . Only substitutions at internal nodes are displayed. Branch lengths are equal to the total number of substitutions across all sites. Vertical bars show the approximate years in which the sequences were isolated. Substitutions C, D, E, and F at site 73 closely follow substitution A at site 391, leading to a highly significant value of the epistasis statistic (
 , nominal
  ). As a result, the ordered pair of sites (391, 73) is detected as epistatic by our method. At the same time, only a single substitution, B, at site 391 follows substitution F at site 73 – and only after a long period of time – resulting in a low value of the epistasis statistic for the inverse pair (
 , nominal
  ). Therefore, the ordered pair of sites (73,391) is not detected as epistatic by our method.

