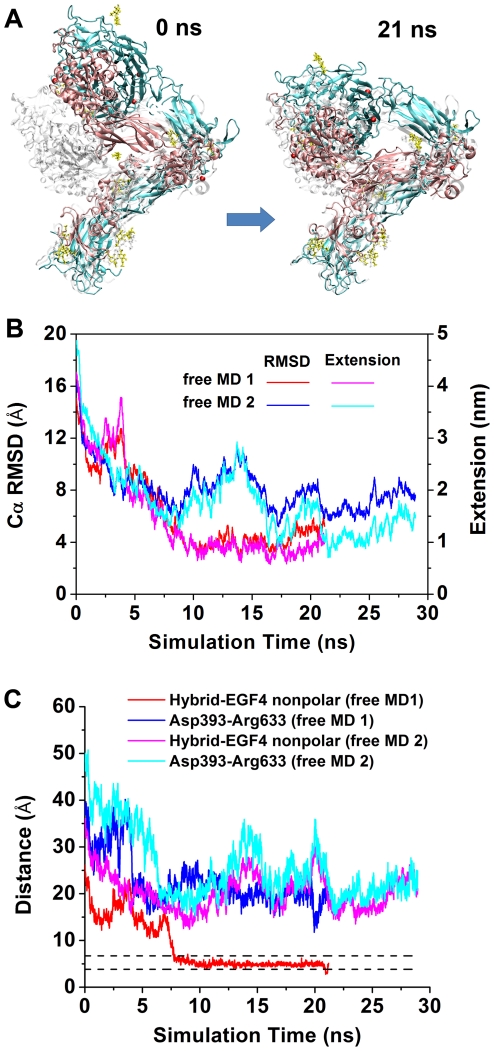
Figure 7. Free MD simulations of a partially-extended conformation.
A. Snapshots of the U1 free MD 1 at indicated times showing rebending from a partially-extended integrin (colored) to the equilibrated bent conformation (gray). B. Time courses of Cα RMSDs relative to the equilibrated bent structure (red and blue, left ordinate) and head-tail extensions (magenta and cyan, right ordinate) in the U1 free MD 1 (red and magenta) and 2 (blue and cyan). C. Distances between the interacting residues, the nonpolar group (red and magenta) and the Asp393-Arg633 salt bridge (blue and cyan) at the respective hybrid/βTD and hybrid/EGF4 interfaces vs. simulation time of the U1 free MD 1 (red and blue) and 2 (magenta and cyan). As references, the upper and lower dashed lines indicate the respective distances of the nonpolar group and the Asp393-Arg633 salt bridge for the equilibrated bent U1 structure.

