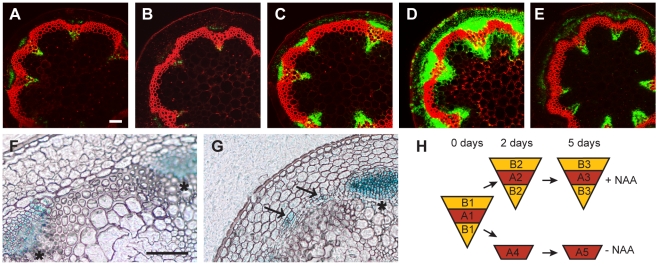
Figure 2. Marker analysis during CIS–incubation and sampling strategy.
(A–E) The activity of the DR5rev:GFP reporter in CIS incubated stems (A–D) without NAA after 2 (A) or 5 days (B), and with apically applied NAA after 2 (C) or 5 days (D) in comparison to a fragment taken from the base of the inflorescence stem of an 18 cm tall plant (E). (F and G) APL:GUS detection in mock-treated (F) and NAA-treated (G) samples after 5 days of CIS-incubation. Signals in interfascicular regions are indicated by arrows. (H) Sampling strategy by LCM as also indicated in Figure 1A. Size bars in (A,F): 100 µm, same magnification in (A–E) and (F–G). The positions of primary vascular bundles are labeled by asterisks.

