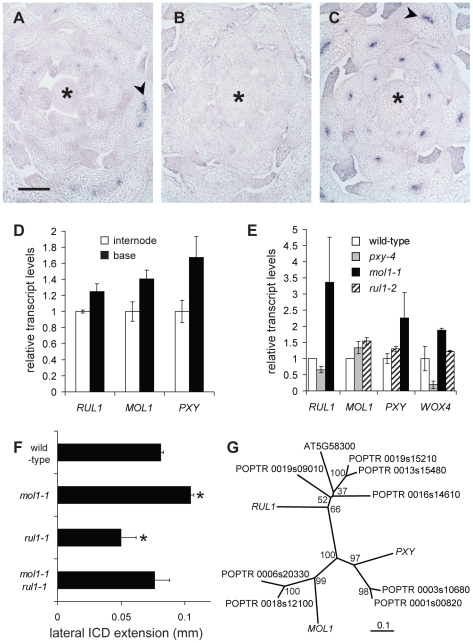
Figure 6. Characterization of RUL1, MOL1, and PXY expression.
(A–C) Detection of RUL1 (A), MOL1 (B) and PXY (C) transcripts by RISH on cross sections of vegetative shoot tips. Asterisks label the apical meristem, arrowheads the cambium-specific signals in leaf bundles. Size bar in (A): 100 µm, same magnification in (A–C). (D) qRT-PCR-based analysis of transcript accumulation in the bottom-most centimeter of the stem and a fragment 3 cm further apically (compare Figure 1C). (E) qRT-PCR-based analysis of RUL1, MOL1, PXY, and WOX4 mRNA abundance in the first internode above the rosette of the corresponding mutants. (F) Genetic interaction between MOL1 and RUL1. Lateral extension of the ICD immediately above the uppermost rosette leaf is shown. (G) Unrooted tree for RUL1, MOL1, and PXY protein sequences, and their closest homologs from Populus trichocarpa based on full length protein sequences. There are two homologs each for MOL1 and PXY with a similar degree of sequence similarity. For RUL1, the situation is less straightforward as another Arabidopsis protein (AT5G58300) belongs to the same sub-clade partly displaying low bootstrap values. The scale bar represents 0.1 amino acid substitutions per position. Bootstrap values are given in percentage.

