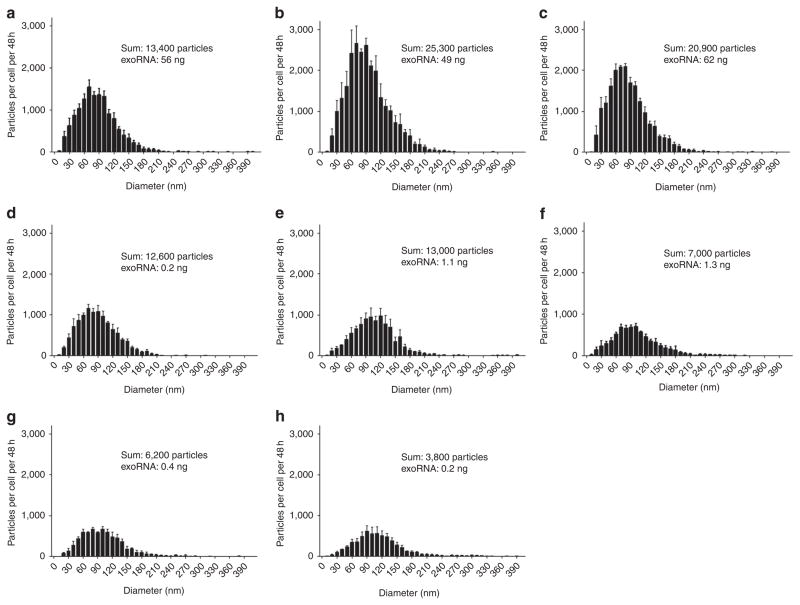
Figure 1. Analysis of microvesicle profiles and RNA yields from different human cell lines.
Microvesicles were isolated from three medulloblastoma cell lines (a, D384, b, D425 and c, D458), one melanoma (d, Yumel 0106), two GBMs (e, 20/3 and f, 11/5) and two normal fibroblasts (g, HF19 and h, HF27) and measured with Nanoparticle Tracking Analysis (NanoSight). The number of particles per cell per 48 h is shown on the y axis, and the size distribution (particle diameter) on the x axis. The sum refers to the total number of particles released per cell over 48 h and the exoRNA refers to the total microvesicle RNA yield per 1×10⁶ cells per 48 h. The results are presented as the mean ± s.e.m. (n = 3).

