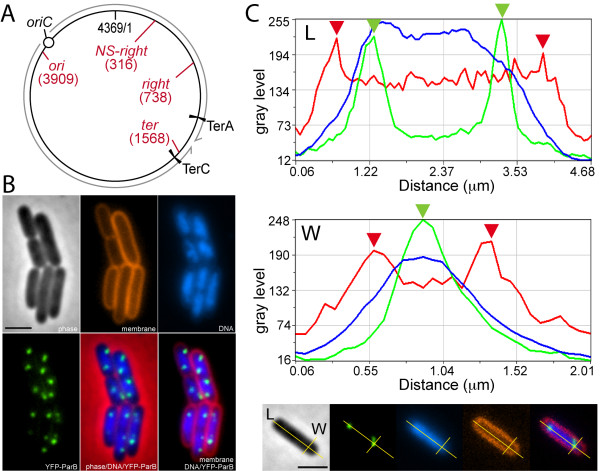
Figure 1.
Positioning of chromosome loci in living cells. (A) A scheme of the E. coli chromosome with relevant features indicated. The replication origin (ori) and the two inner replication terminators (TerA and TerC) defining the zone of replication termination are shown. The grey arrows indicate the sense of replication. The loci used for insertion of the parS site are shown in red. Coordinates are in kb. (B) Micrographs of cells harbouring the YFP-ParB foci at the ori locus. From top left to bottom right: phase contrast; membrane staining (FM 4-64); DNA staining (DAPI); YFP-ParB foci; overlay phase/DNA/YFP-ParB; overlay membrane/DNA/ParB. (C) Linescan analysis of fluorescence signals along cell length (L, top panel) and cell diameter (W, middle panel). Linescans of fluorescence intensities (Y-axis, in Gray Level units) for the cell membrane (red); DNA (blue) and YFP-ParB (green) are shown along the two cell axes (X-axis in μm). Red arrowheads indicate the cell boundaries and green arrowheads show the positions of YFP-ParB foci. The bottom panel shows micrographs of the cell scanned in the panels above with the two linescans used (from left to right: phase contrast; YFP-ParB; DNA; membrane; overlay YFP-ParB/DNA/membrane). Scale bars are 2 μm.

