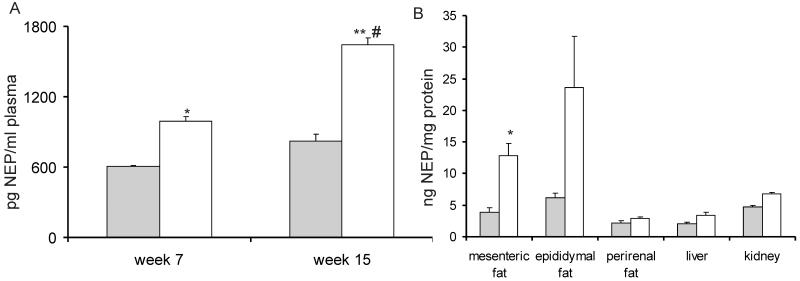
Figure 4. NEP plasma and tissue levels in a mouse model of high-fat diet (HFD) induced insulin resistance.
A: After 7 and 15 weeks of diet, mice were bled from the lateral saphenous vein and NEP protein levels were measured. Grey bar: NCD-fed mice, white bar: HFD-fed mice. Results are presented as mean±SEM from n=8 mice. * p<0.05 vs. NCD, ** p<0.01 vs. NCD, # p<0.05 vs. HFD week 7. B: Tissues were harvested after 15 weeks of diet and NEP protein levels were measured in mesenteric adipose tissue (AT), epididymal AT, perirenal AT, liver, and kidney. Grey bar: NCD-fed, white bar: HFD-fed. NEP levels are expressed as a ratio of ng NEP to mg total protein. Data are presented as median and 25th and 75th percentile from n=8 mice. *p < 0.05 vs. NCD.

