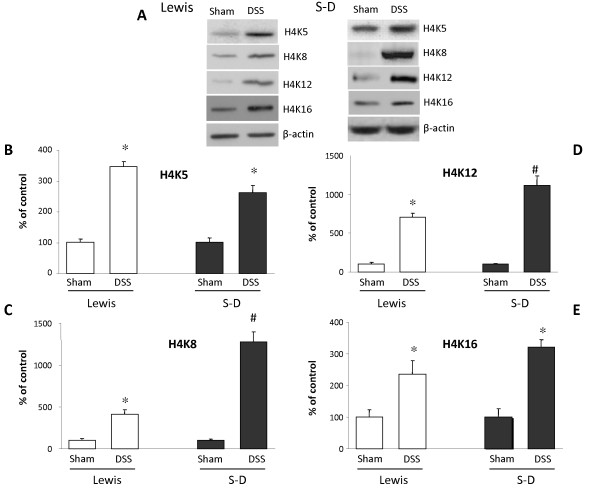
Figure 4.
Acetylation on histone 4 (H4) specific lysine residues 5 (K5), 8 (K8), 12 (K12) and 16 (K16) in Lewis and Sprague-Dawley dextran sulfate sodium (5% DSS). A: Representative bands of H4K5, K8, K12 and K16 acetylation. Lanes for Lewis rats represent: non-DSS treated (control) and DSS-treated. Likewise representative bands are illustrated for the Sprague-Dawley rats. Graphical representation of Western blotting data. H4 acetylation of K5 (B), K8 (C), K12 (D) and K16 (E). Columns represent the mean ± SEM (bar) of three independent experiments.

