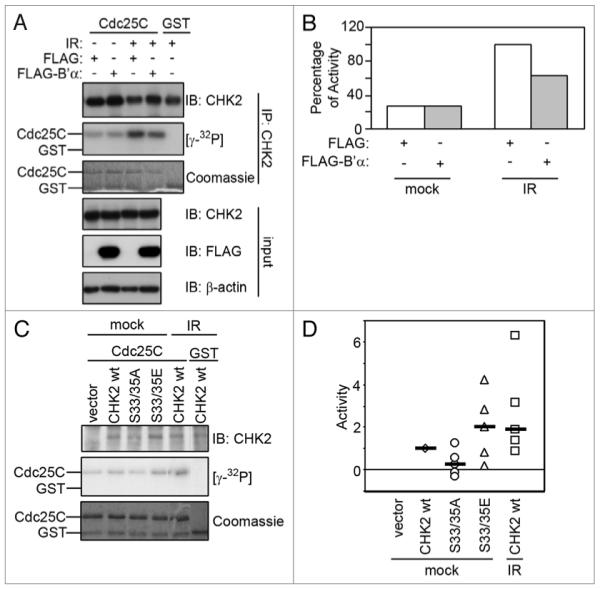
Figure 6.

Effects of irradiation on CHK2 kinase activity. (A) 293T cells expressing FLAG-B’α or FLAG (as a negative control) were irradiated with 20 Gy and incubated for 1 h. Whole cell lysates were immunoprecipitated using a CHK2 antibody and incubated in an in vitro kinase assay using GST-Cdc25C (amino acids 200–256) as a substrate. (B) Autoradiographs in (A) were normalized against the levels of CHK2 protein per sample and represented by graphs. 100% activity was defined by the amount in the negative control sample after IR. (C) HCT15 cells were transiently transfected with empty vector (vector), CHK2 WT, S33/35A or S33/35E and mock-irradiated or exposed to 20 Gy IR and incubated for 1 h. Cell lysates were immunoprecipitated and incubated in an in vitro kinase assay using GST-Cdc25C (amino acids 200–256) as a substrate. (D) Five experiments as done in (C) were plotted on a single graph. Activity of 1 was defined as the activity in the CHK2 WT mock-treated sample. The median of each set of data points is shown with a black bar.
