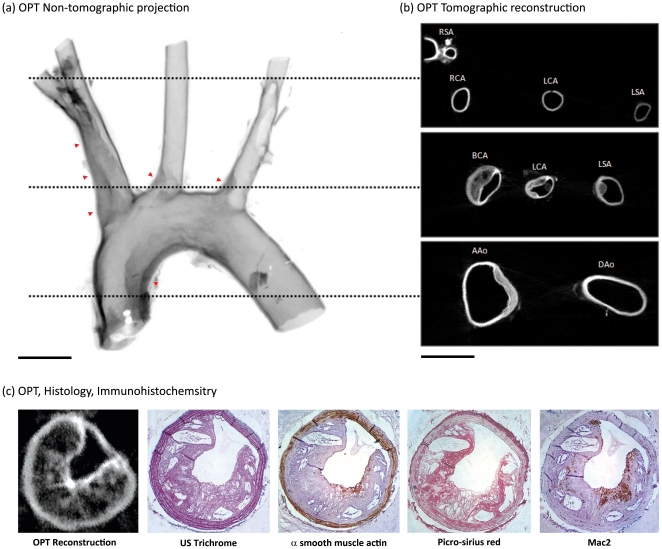
Figure 2. Identification of atherosclerotic lesion formation in the aortic arch of apoE-/- mice.
In non-tomographic fluorescent emission images of the aortic arch of atherosclerotic mice (a), lesion formation (red arrowheads) is apparent with the expected distribution. Image has been inverted for clarity (darker regions reflect stronger emission). In cross-sectional reconstructions, lesions are visible with the same distribution (b) and possess strong resemblance to histological sections of the same vessels (c). Successful analysis of the brachiocephalic artery by standard (immuno)-histochemical procedures further emphasises the non-destructive nature of this technique (c). Scale bars in (a–b) are 1 mm. RSA, right subclavian artery; RCA, right carotid artery; LCA, left carotid artery; LSA, left subclavian artery; BCA, brachiocephalic artery; AAo, ascending aorta; DAo, descending aorta.

