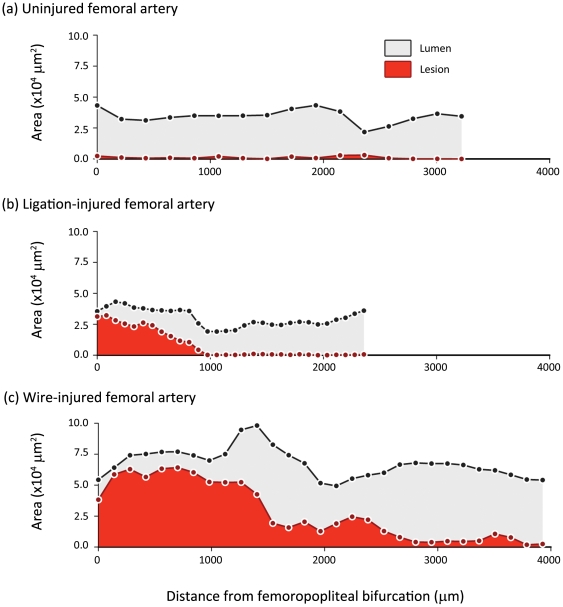
Figure 4. Longitudinal profiles of lesion and lumen cross-sectional area in un-injured, ligation- and wire-injured femoral arteries.
When cross-sectional area of lesion (red) and lumen (grey) are plotted against distance along the axial length of the femoral artery, the difference in extent of lesion formation between ligation- (b) and wire-injury models (c) is apparent. In both cases, the variability in lesion size that occurs along the length of each vessel is also highlighted.

