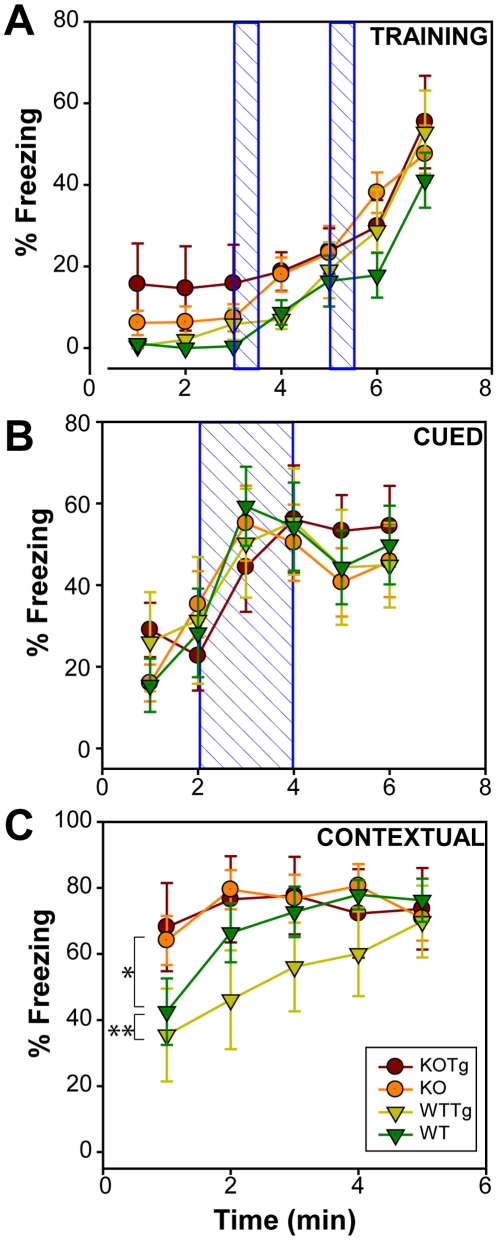
Figure 5. Fear conditioning test.
Percent freezing of mice over time during Training (Top), Cued test (middle) and Contextual test (bottom). Mean values ± SEM are plotted. Data were analyzed by two-way repeated measure ANOVA. Differences between groups were not significant for training and cued tests. In contextual tests, WT performed significantly better than WTTg (p = 0.003); difference between WTTg and KOTg was significant (p = 0.014); other groups were not significantly different. Blue hatched boxes represent two separate auditory signals (80dB) of 30 seconds each during training and a single auditory signal for 2 minutes during cued test followed by 2 sec foot shock. Symbol representations are - KOTg (red circle), KO (orange circle), WTTg (yellow triangle) and WT (green triangle). (n = 7 for KOTg; n = 15 for KO; n = 7 for WTTg and n = 9 for WT).

