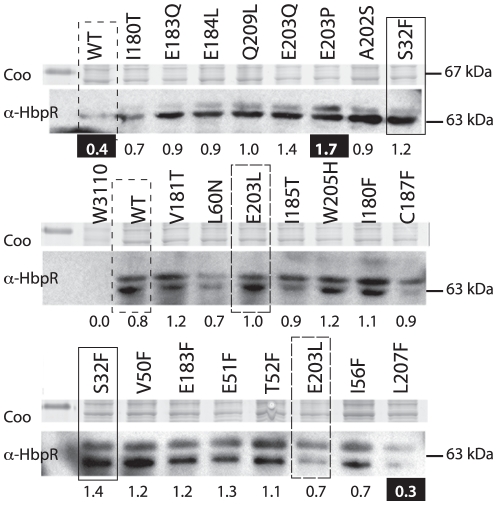
Figure 4. HbpR (mutant) expression in E. coli from pHBP269A0-plasmids, i.e., those which were used for 2-HBP induced EGFP expression from PC. Coo, Coomassie-Blue-stained SDS-PAGE gel fragment around 67 kDa. α-HbpR, bands on gel detected in Western blotting with anti-HbpR antibodies.
Relevant mutations are indicated; note that wild-type and several mutants were analyzed twice. Numbers below the gel fragments indicate the average normalized intensities of both HbpR bands for each mutant or wild-type. Those numbers highlighted in white on black background point to values below or above the 25 and 75% quantiles of all measured intensities.

