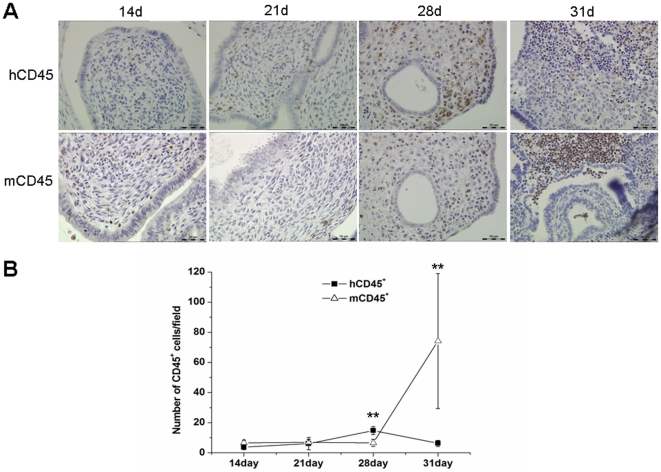
Figure 5. Immunohistochemistry detection of hCD45 and mCD45.
(A) hCD45 and mCD45 staining from the 14d, 21d, 28d, and 31d groups. Original magnification: 400×. (B) hCD45+ and mCD45+ cell counts. Number of hCD45+ or mCD45+ cells was counted according to staining results. Statistical significance was assessed by the Student's t-test. **P<0.01.

