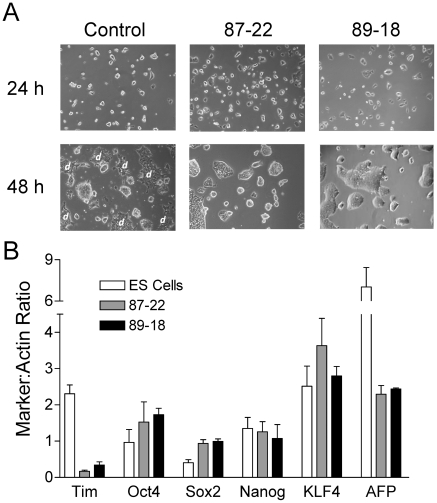
Figure 4. Knockdown of Tim suppresses spontaneous differentiation of mES cells.
A, Representative images of control and Tim knockdown ES cell lines 87-22 and 89-18 after 24 and 48 h in culture. Note that spontaneously differentiating mES cell clusters are readily apparent in control ES cell cultures by 48 h (flat colonies with ragged edges; “d”) but are absent from the Tim knockdown cultures. B, Analysis of self-renewal and differentiation marker expression in Tim knockdown cell lines. Expression levels of the self-renewal markers Oct4, Sox2, Nanog, KLF4, the differentiation marker AFP, as well as Tim were assessed by quantitative immunoblotting (LI-COR Odyssey infrared imaging system) of cell lysates from parental ES cells as well as the Tim knockdown ES cell lines 87-22 and 89-18. Actin immunoblots served as loading control. Immunoblots were performed in triplicate and the level of each protein was normalized to actin and is shown in the bargraph as the mean ± S.E.M. Sox2 expression levels were significantly increased in the Tim knockdown cells relative to parental ES cells (p<0.05), while AFP showed a statistically significant decrease (p<0.05). While small increases in Oct4 expression were also observed in the Tim knockdown cell lines, these changes were not statistically significant.

