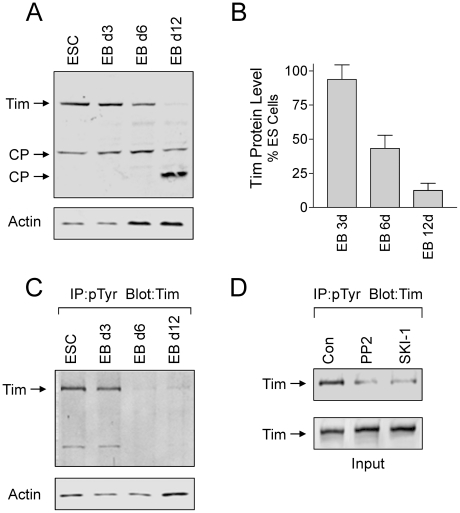
Figure 9. Changes in Tim protein levels and tyrosine phosphorylation during EB formation.
A and B, Tim protein levels diminish during EB formation. Lysates were prepared from self-renewing ES cells (ESC) and 3, 6, and 12 day EBs, and immunoblotted for Tim and actin protein levels. Full length Tim as well as two possible cleavage products (CP) are indicated by the arrows. Relative band intensities for full-length Tim and actin were determined using ImageJ from four independent experiments and Tim:actin ratios were calculated. The results were normalized to ratios obtained from control ES cells, and are presented in the bargraph as the mean ± S.E.M. The level of Tim was significantly reduced after 6 and 12 days of EB formation (p≤0.01). C, Tyrosine phosphorylation of endogenous Tim in ES cells and EBs. Lysates were prepared from self-renewing ES cells and 3, 6, and 12 day EBs, and tyrosine-phosphorylated proteins were immunoprecipitated from protein aliquots and analyzed for Tim by immunoblotting (top panel). Actin blots were performed to verify equivalent levels of input protein for the immunoprecipitation (lower panel). This experiments was repeated three times with comparable results; a representative example is shown. D, Inhibition of Tim tyrosine phosphorylation in ES cells by Src-family kinase inhibitors. ES cells were incubated with the Src-family kinase inhibitors PP2 and SKI-1 [12] at 10 µM for 16 h. Tyrosine-phosphorylated proteins were immunoprecipitated and analyzed for the presence of Tim by immunoblotting (top panel). Tim blots (lower panel) verified equivalent levels of Tim in each lysate prior to immunoprecipitation.

